Data Visualization Consulting

Explore Your Data
Develop Insights
Improve Performance
Data visualizations make your vast amounts of data more accessible and understandable, using charts and graphs to tell stories and answer questions about your business. See how our data visualization consulting experts can help you EVOLVE.
Making Sense of Data is Critical for Decision Making
Running your company requires good decision making. This requires research and analysis, none of which can be done without data. But just having data won’t help. You need to organize and present it in a way that clearly answers the questions that will drive you to correct, well-informed decisions.
Data Visualization Consulting Helps You Understand Data
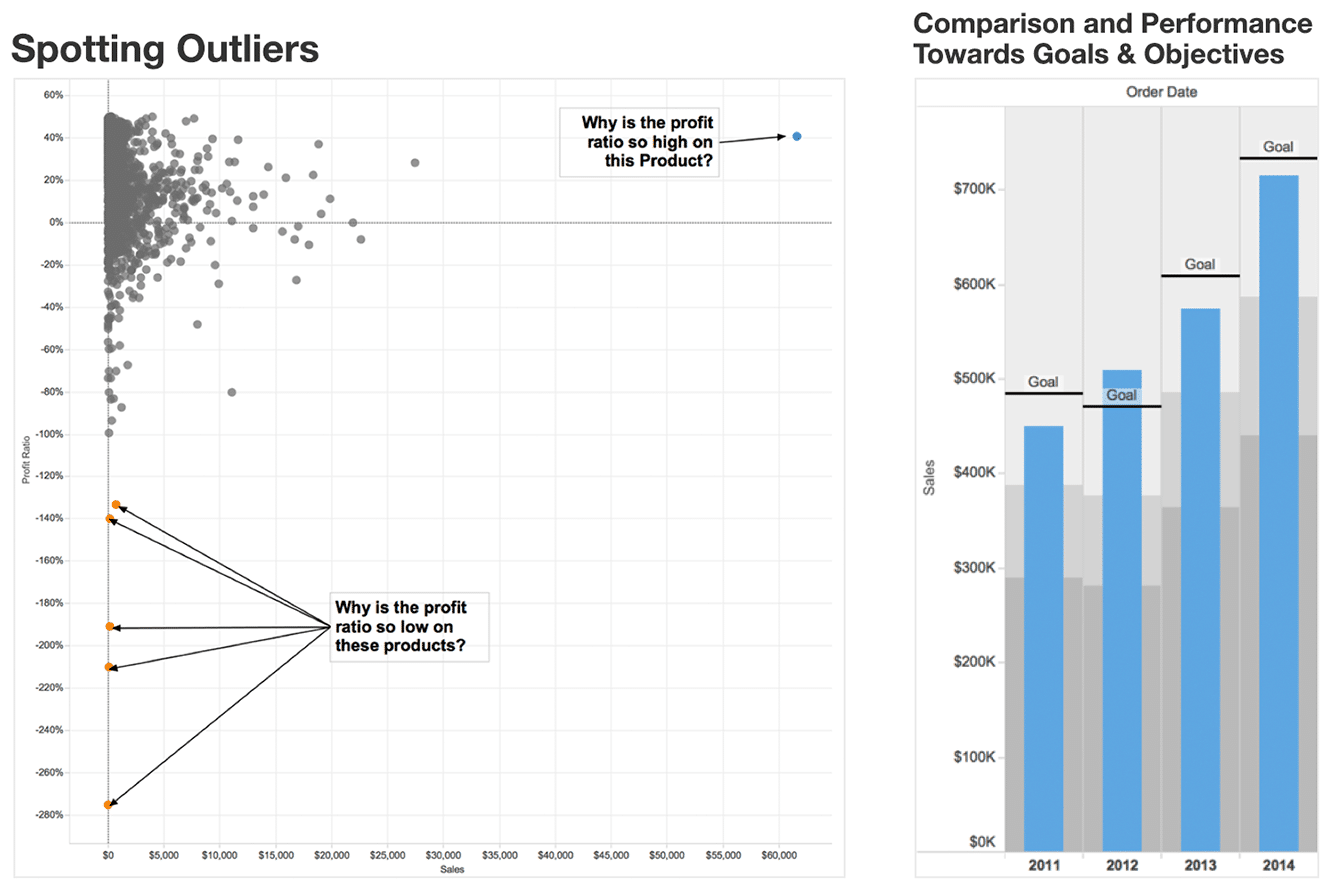
Tools that transform data into visualizations have come to the forefront in recent years, replacing the text-based reports to which we are accustomed. Visualizations aren’t simply a trend, however. They are an advancement, since our brains are wired to quickly analyze and understand visualizations much quicker than reading and interpreting text. Our data visualization services can help you identify trends, comparison and performance towards goals and objectives, and spot any outliers.
Benefits of Visualizations
Done correctly, transforming your company’s data into visualizations will result in the ability to:
- Quickly identify performance towards goals and objectives
- Clearly point out that something deserves attention
- Pinpoint what action needs to be taken
- Make unexpected discoveries
- Build informed decisions based on facts
- Improve your company performance
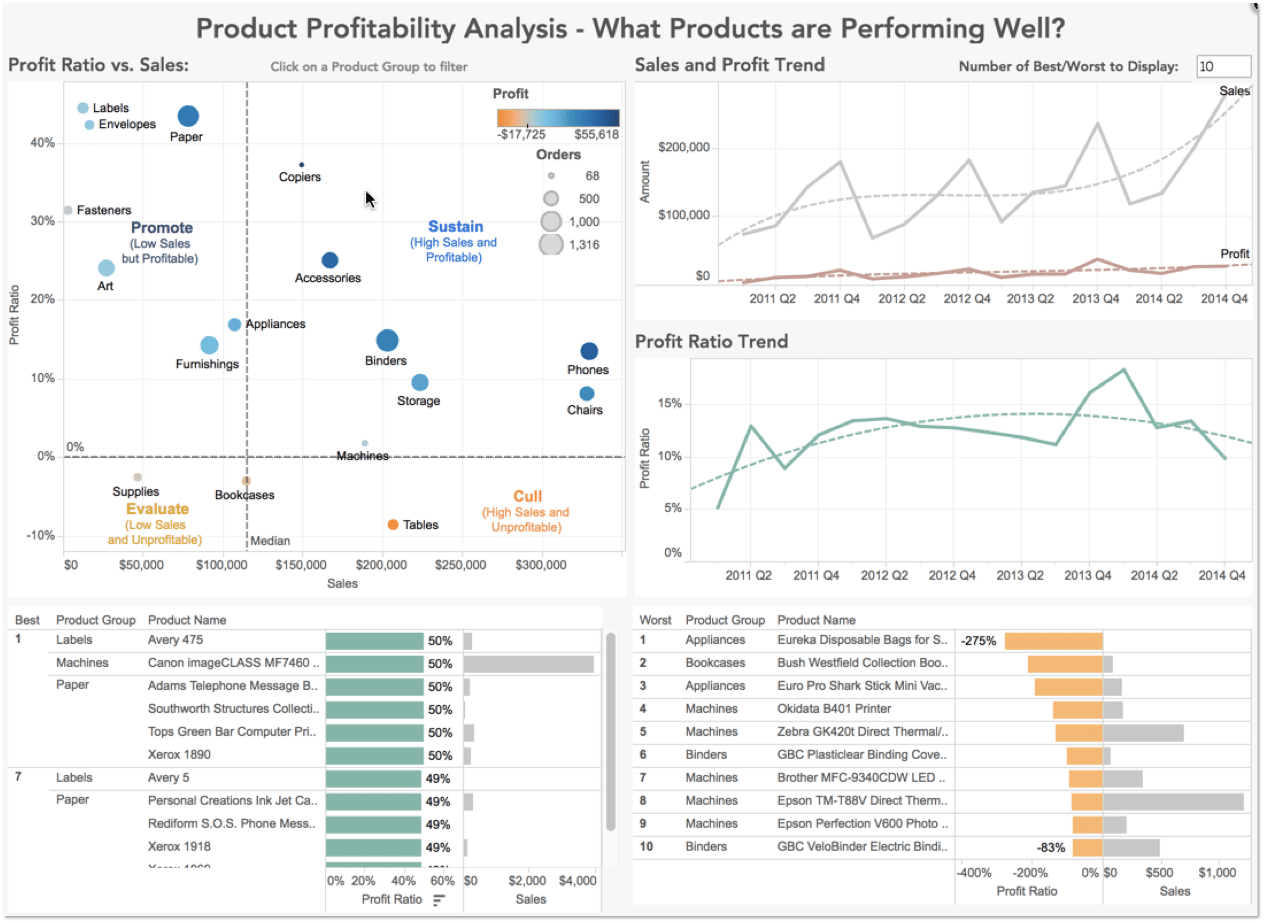 View Interactive Data Visualization Example
Visualization Expertise Delivered by Blast
If you want to get a solid handle on your data so that you can begin to answer business questions, develop insights, and make better-informed decisions, our analytics consultants can help and put their diverse industry experience to work for your company. The size of your company and source of your data (e.g. spreadsheets, .csv files, databases, data warehouse, etc.), doesn’t matter, as we have a strong team of data visualization consultants that can quickly help you:
- Connect to your data
- Explore, analyze, and visualize your data
- Choose the appropriate visualization
- Develop insights
- Share and act on results
Data Visualization Tools We Work With:
Blast’s expert data visualization and dashboard consultants can help you evaluate and select the tool that best meets your needs.
Google Data Studio
Transform data into clear, informative reports that are easy to read, easy to share, and fully customizable (free version or Data Studio 360)
Domo
Easily view and consume your business data in real time via cloud-based SaaS software on any device
Consultant Spotlight

Meet Nick Mannon
Director, Data Solutions
Nick works with clients to help them understand and utilize their data for better decision-making and improved results. He is skilled at — and passionate about — organizing and presenting data in a way that clearly answers clients’ important business questions, providing insights to help them EVOLVE their organizations.
Thanks, Nick! I really like the “New Customer Analysis” tab. Every which way I want to look at our new customers is there. Overall, the dashboards you’ve set up enable us to gain greater insights for better decision making – for example, around customers placing orders over a specific timeframe.
Sajid Hasan – Chief Technology Officer
