Civil Beat: Data Visualization Reveals Subscriber Retention and Content Readership Insights
Overview
Civil Beat wanted to gain a deeper understanding of user engagement on their site, as well as subscriber cohort activity.
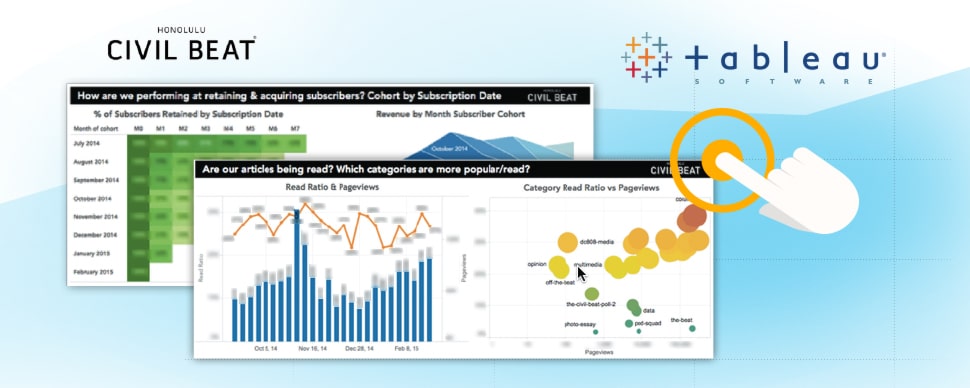
Blast Analytics & Marketing recommended custom marketing visualization dashboards using Tableau as the visualization tool, and Google Analytics as the data source.
Challenge
One of the challenges for a news/media outlet is to understand content engagement, in order to provide their readers with valuable content that keeps them coming back. These metrics not only tie back to part of their core mission, but are also important to those who are sponsoring specific articles.
Also, Civil Beat wanted to gain a better understanding of subscriber activity on their site www.civilbeat.org.
Solution
Blast conducted a discovery process with Civil Beat to identify questions and metrics that were key to their business. Some important questions Civil Beat was looking to answer were:
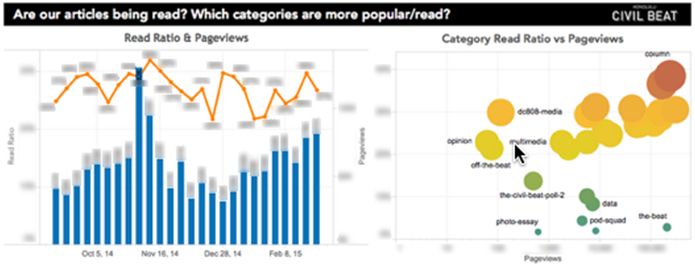
- How many times was a specific article read?
- Which categories of articles are read the most?
- How is article X doing in relation to article Y in readership?
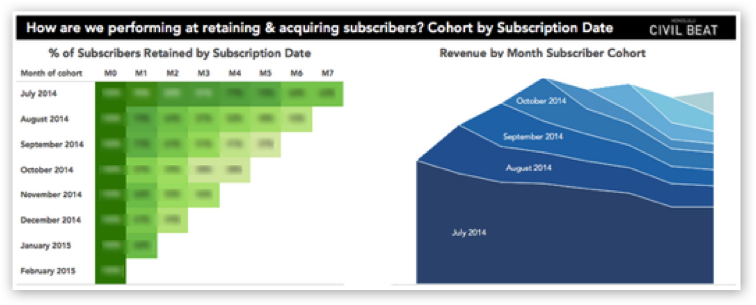
- From our current subscribers how many are new and how many are retained each month?
- What is the subscriber lifecycle?
- How do our initiatives affect retention?
After their needs were defined, Blast performed a custom Google Analytics implementation to enable the ability to track when an article was read or scanned, and individual subscriber activity on the site.
The cohort analysis allowed Civil Beat to better understand their subscriber cohorts and optimize the retention and acquisition initiatives.
For data visualization and reporting, a Tableau Server was deployed on Amazon EC2.
Results
By leveraging Google Analytics Standard (via custom implementation) and Tableau Visualization Software, Blast empowered Civil Beat editorial and management teams with actionable and easy-to-understand data.
The cohort analysis allowed Civil Beat to better understand their subscriber cohorts and optimize the retention and acquisition initiatives.
The ‘read index’ allows the editor and management team to not only see an overview of readership, but also drill-down into readership by:
- article,
- category,
- and journalist.
This provided invaluable insights into the topics that resonate with their community.
This automated data visualization/report solution is now used daily at Civil Beat. It drives marketers and editors to generate valuable content that engages their readers and improves subscriber retention.
Blast AM is a key partner for Civil Beat. Civil Beat’s primary mission is to positively impact our community. It is key for us to not only understand how our readers are engaging with our content, but also how we can grow that engagement. Blast AM has continuously helped us to leverage our analytics in a way that focuses on our mission, as well as our business objectives.
Heidi Pliszka, Director of Business Operations
![]()
Project Overview
Goals
- Gain a deeper understanding of user engagement on their site, as well as subscriber cohort activity
Approach
- Discovery process to identify questions and metrics that were key to their business
- Custom Google Analytics implementation to enable tracking
- Custom marketing visualization dashboards using Tableau as the visualization tool, and Google Analytics as the data source
Results
- Cohort analysis helped Civil Beat understand their subscriber cohorts and optimize retention and acquisition initiatives
- The “read index” allowed editor and management team to see an overview of readership and drill down by article, category, and journalist
- Helped drive and generate content valuable to their readers and improve subscription retention
Download Case Study

Services


If you have questions or you’re ready to discuss how Blast can help you EVOLVE your organization, talk to an Analytics Consultant today.
Call 1 (888) 252-7866 or contact us below.


