Analytics Blog

Problem with Site Speed Accuracy in Google Analytics
As analysts, we are sometimes blinded by the simplicity of our tools. We load up our reporting tool and it shows us data; data that we intend to use to make critical business decisions.
But what if the data is misleading?
The Site Speed report in Google Analytics (Standard and 360 editions) is an example of a report that may lead you to make bad decisions on data that is technically accurate (but misleading).
This report’s poor data quality can lead to false alarms, wastefulness of responsible resources, and panic.
On the flip side, when you’re informed about how to read the data in this report, you can make huge improvements that benefit your business.
Site Speed Information is Critical
Site speed in Google Analytics is computed by collecting browser timing data from sessions on your website — more specifically from a sampling of all sessions. There is helpful information collected, such as:
- Page Load Time
- Domain Lookup Time
- Server Connection Time
- Server Response Time
- Page Download Time
This data is automatically collected for some of your traffic and exposed in reporting via Behavior -> Site Speed -> Page Timings.

The speed of your website is a critical factor for the success of your business. A one-second delay in page load time can result in a 7% reduction in conversions (source). Further, the speed of your site can be a ranking factor on search engines such as Google.
For these reasons, organizations have an objective to improve page load performance and continually monitor it for improvements that can result in sizable gains.
Problem: Site Speed Data Is Sampled
How does the sampling of speed data work?
The Google Analytics code randomly selects sessions to collect this type of data from the browser. The data processing is fixed at a 1% sampling rate. This is referred to as “client-side data sampling”, which samples the data even before it is processed by the tool.
Google likely does this because in theory 1% of your data should give you a fairly representative view of the actual data.

All modern browsers support the site speed collection capability: Chrome, Firefox 7+, Internet Explorer 9+, Android 4.0+, and others that support the HTML5 Navigation Timing interface.
Further, Google has restrictions on the amount of data that it will process. According to the Timing Hits quota documentation, “the maximum number of timing hits that will be processed per property per day is the greater of 10,000 or 1% of the total number of page views processed for that property that day.”
These timing hit limits also apply to Google Analytics 360 (formerly Google Analytics Premium).
![]()
![]() Note that this is slightly different from the sampling in Google Analytics processing that occurs, which can be overcome by using Google Analytics 360 or other tools such as Blast’s own unSampler product. There is no way (even with Google Analytics 360), currently, to overcome the adverse impact of Site Speed report data sampling.
Note that this is slightly different from the sampling in Google Analytics processing that occurs, which can be overcome by using Google Analytics 360 or other tools such as Blast’s own unSampler product. There is no way (even with Google Analytics 360), currently, to overcome the adverse impact of Site Speed report data sampling.
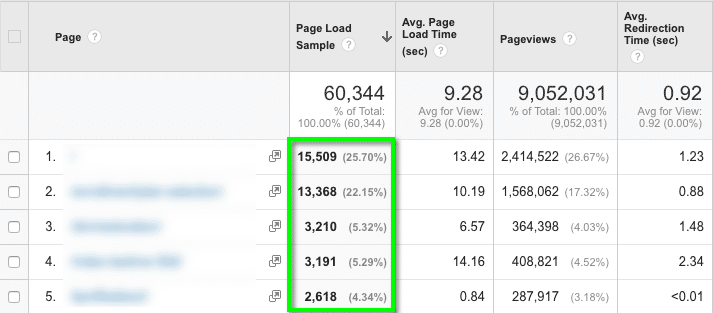
Due to the high sampling of data in the Site Speed/Page Timing report, you may make decisions based on pages where there were very few samples collected (always look at the sample size metric in the technical report view).
We’ve seen reports that show pages with over 30 seconds of page load time, but it was the average of just a few samples (likely a combination of normal and outliers).
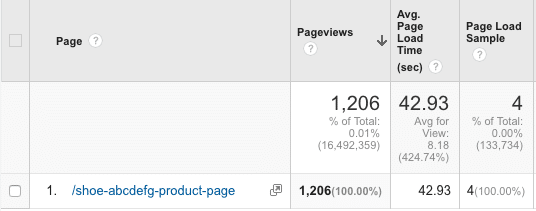
In the report above for a product detail page, there were over 1200 page views, but yet only 4 page load samples were collected (0.33% sample size). The entire site average is just 8.18 seconds.
When you start to drill into individual pages on reports, you MUST keep the sample size in context. Unfortunately, Google Analytics does not expose the granular page load time per sample, but it could have been something like this:
| Page Load Sample # | Load Time |
| 1 | 8.0 seconds |
| 2 | 8.2 seconds |
| 3 | 7.2 seconds |
| 4 | 148.3 seconds |
| Average | 42.93 seconds |
Potential Solution: Adjust Tracking Code
Google Analytics is making assumptions about how much data it should capture.
The rules in the Google Analytics documentation state that by default, only 1% of your traffic will be randomly selected to capture these metrics. As stated above, either 1% of 10,000 timing hits will be processed per day per property.
You can adjust the Google Analytics tracking code to specify a higher percentage of data collection. The issue is that Google Analytics will only process up to 1% of total hits or 10,000 hits (whichever is greater), regardless of sending more than the allotted hits.
This technique of adjusting the sample rate can be helpful on smaller sites, but it really won’t help you on larger sites. The code in Universal Analytics to adjust to a higher percentage needs to be a part of the create method.
ga(‘create’, ‘UA-XXXX-Y’, {‘siteSpeedSampleRate’: 10}); //change to 10% sample
Unfortunately, there is no current way (even by using User Timing Hits) to completely get around the sampling issue. We do hope the Google team changes this limit.
Problem: Data Can Be Misleading

By default, when you navigate to the Site Speed Page Timings report (Reporting -> Behavior -> Site Speed -> Page Timings), you’ll get a view that looks like this:
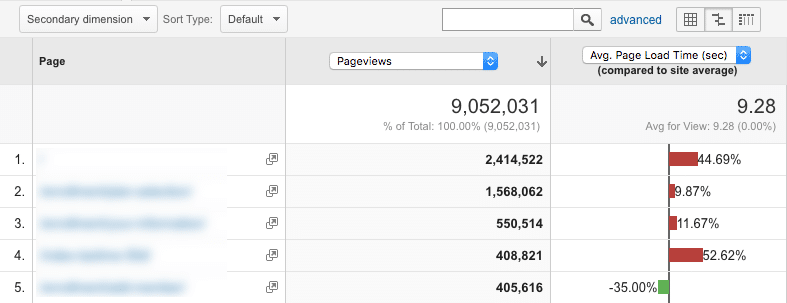
While this Comparison view is helpful for understanding Page Load Time in comparison to the overall site, you’ll likely want to switch to the Data Table view to see more details:
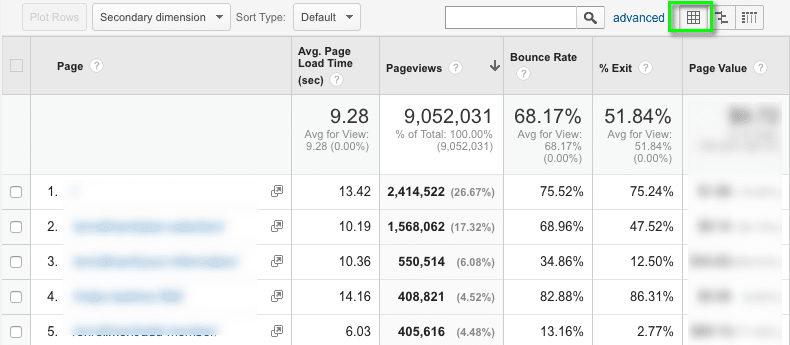
This is slightly better because you can now see the Average Page Load Time in seconds by individual page.
You may decide to filter the report for a specific page or sort descending on the Average Page Load Time column.
What you’ll end up with is likely misleading because it is going to show you pages with a high load time that you may think are the most actionable pages to address.
The problem is that you don’t have all of the data — specifically an understanding that the data is sampled and that you don’t have context to understand how many samples were included in the computation of this metric.
Solution: Consider the Context
When looking at the Average Page Load Time metric in Google Analytics, ALWAYS switch to the Technical view of the report as well as the Data Table view. Optionally, import import this Custom Report for a quicker way to view this data in a more actionable and context-aware method.
While this type of data is convenient to report within Google Analytics, be aware that there are other tools that provide similar data:
- Keynote, Pingdom – There are a number of these tools on the market. They continually load your site from multiple locations throughout the world and report the data back to you in a reporting interface.
- New Relic – This tool uses real-user browser data to provide detailed information and alerts around performance of your site or application.
- Ghostery MCM – This tool provides tag and page load performance data from a sample of users that have opted in from Ghostery’s toolbar extension.
Product Suggestion for the Google Analytics Team
There are a number of ways that the product team at Google can address these critical issues and improve the accuracy of analyst insights:
- Allow more Timing Hits for speed data to be processed to address the sampling issues (especially for Google Analytics 360 clients). Since these count as hits as part of the contract, Google Analytics 360 clients should have control to capture this data on all sessions if they wish.
- Adjust the default report that is shown to more directly include the Page Load Sample size metric. By more clearly exposing this sampling metric, it may reduce confusion with users that this is the type of sampling that you may experience in other reports (sampling as a result of too much data). In fact, these two types of sampling are quite different.
While the tools we use day-to-day make our lives easier, it is business-critical to understand how things are working and to also question the data. Instead of alerting your technical performance team to an issue, make proper sense of the data first.
When you fully understand the data, you will reduce the confusion and the wastefulness of precious resources to address non-issues; in return you’ll have more time to use the data accurately to make more impactful business decisions.


