Analytics Blog

Do You Really Need to Track That? Understanding the Difference Between Analytics Wants and Analytics Needs
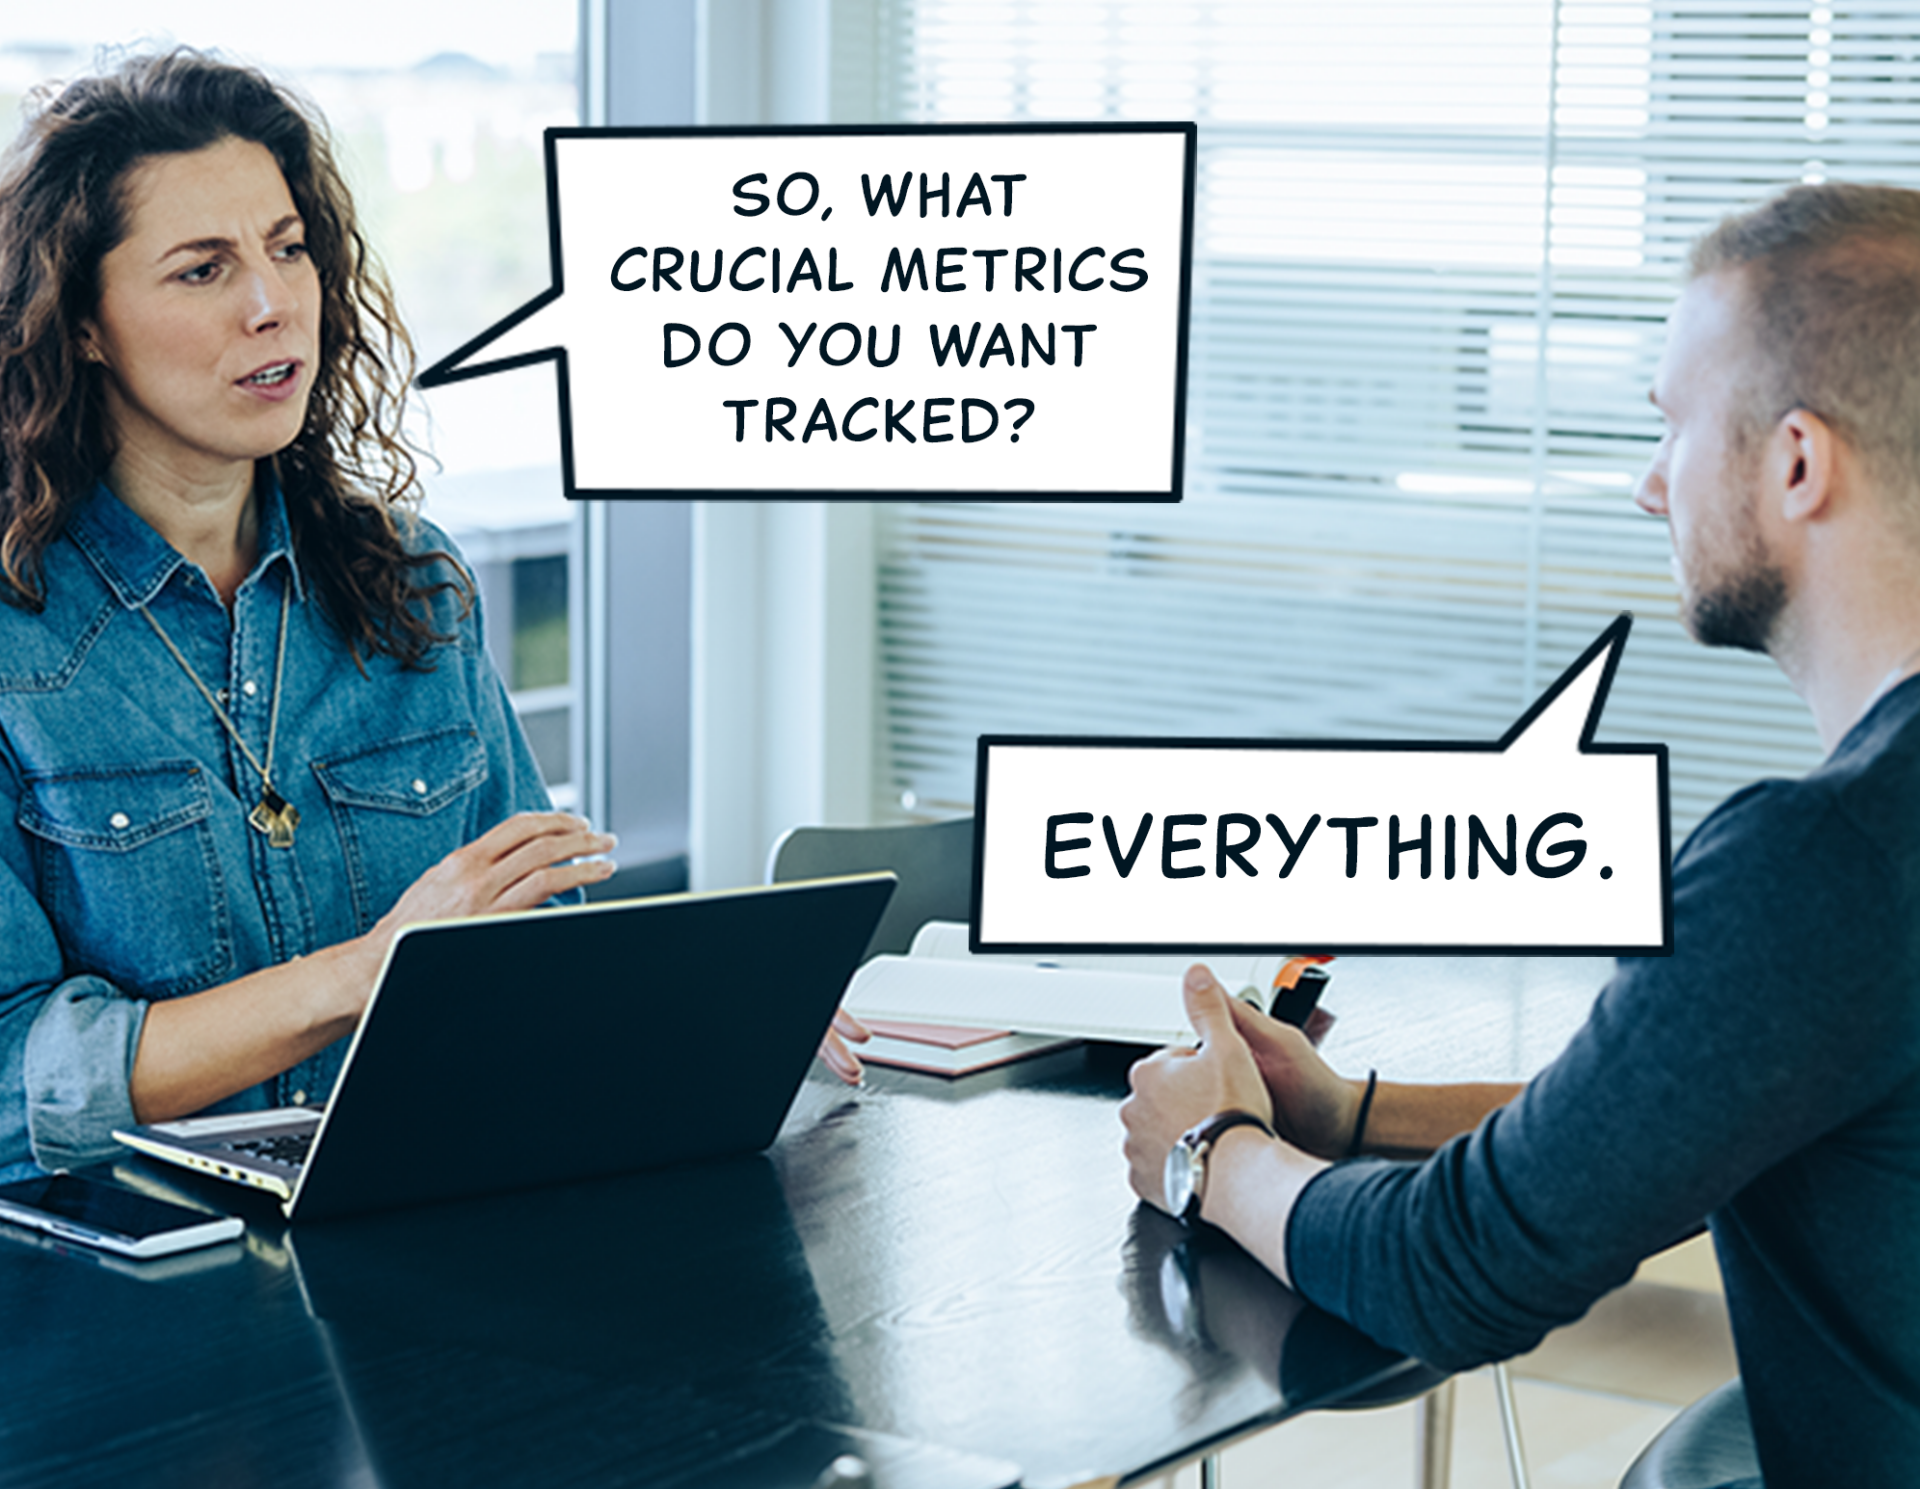
All too often when a client is asked what they want to track, the answer is “everything.” Clients often don’t really know what they want or will need to achieve business goals, and the default response is to track everything that can possibly be tracked. However, the “track everything” mindset often leads to too much data, most of which is rarely looked at—let alone used. In addition, having too much data can easily lead to data clutter, making it hard to see what’s really important and keeping teams from delivering valuable insights to their organizations. The “track everything” mindset is a classic example of prioritizing wants over needs.
Why the “Track Everything” Mindset is So Common

There are many reasons why people default to the “track everything” mindset. Here are four of the most common ones:
- Lack of key performance indicators (KPIs)
- Not understanding the difference between nice-to-haves and crucial data
- Being worried about not capturing enough data
- Not knowing how the data can help them or what analytics capabilities are available to them
Lack of KPIs and the Necessary Time to Create Them
Most organizations have a range of desired business outcomes, yet many struggle to translate these into KPIs that the organization can use to measure whether they’re achieving those outcomes. This is especially true in the initial steps of identifying what data they need to wrangle from their digital touchpoints.
Of course, running a business or otherwise being involved in an organization’s daily operations leads to some very busy schedules. Teams are often too busy and have too much on their plates to slow down and focus on writing KPIs for the business. This inevitably leads to headaches: not doing the appropriate analytics prep work in the beginning can lead to larger workloads later—usually in the form of messy reports that need to be filtered, sorted through, or even redone due to inaccuracies.
Nice-to-Haves vs. Crucial Data
Curiosity is great and is a particularly desirable trait when trying to glean valuable information through data analysis, but it’s important to rein it in when deciding which information to track. Too much curiosity can quickly muddy the waters, leading teams to collect more data than necessary on topics with little or no bearing on an organization’s KPIs.
“Nice-to-have” data is, well, nice to have—but it isn’t always needed right away and can sometimes go without ever being looked at. As companies change and the digital functionality evolves, these “nice-to-haves” tend to become obsolete in the future. This sort of data can easily create more problems than helpful insights, especially when there may be potential cost implications in tracking, processing, and storing the additional data.
Not Enough Tracking vs. Over-Tracking
Not having the proper data when you need it can feel like an organization’s worst nightmare. The thought of not being able to answer critical business questions can give stakeholders anxiety, so they resort to tracking everything “to be safe.” As a result, massive amounts of data are captured and subsequently ignored due to the high level of effort required to understand them. This typically either leaves the business questions unanswered or creates a skewed perception of what’s going on with the data.
It’s important to maintain a balance between not tracking enough, which can hinder your data analysis abilities; and tracking too much, leading to information overload and ultimately analysis paralysis.
The thought of not being able to answer critical business questions can give stakeholders anxiety, so they resort to tracking everything “to be safe.”
Information overload can lead to results that are directly opposed to what the organization set out to achieve. Instead of lending itself to a “dream” data framework that helps the organization find and deliver insights to drive better business results, the sheer amount of data becomes overwhelming. This leaves the organization struggling to understand all of the available information and how it might be used to improve business results.
Lack of Analytics Knowledge
The analytics industry is in a constant state of growth and change, so it’s unsurprising that many organizations struggle to keep up. There are also crucial knowledge barriers that prevent organizations from understanding which tools will meet their needs and how they should use those tools. Organizations must take the time to tear down these knowledge barriers, and the first step is to gain an understanding of the organization’s current tools.
Data literacy is key to being able to understand the data your organization tracks, and it can also prove very valuable at the start of the analytics journey. However, many organizations don’t know enough about analytics to confidently claim data literacy. This lack of knowledge can lead organizations straight to the “track everything” mindset; and without knowing how various analytics platforms can help them (tool capability) and what the terminology means (tool jargon), organizations frequently end up under-utilizing areas of their current analytics platforms while over-utilizing other areas.
Separating Analytics Wants from Analytics Needs

The first step to changing the “track everything” mindset is to identify the difference between the data you want and the data you need. Doing so will require a fundamental shift in how you think about data and its relationship to your business.
KPIs
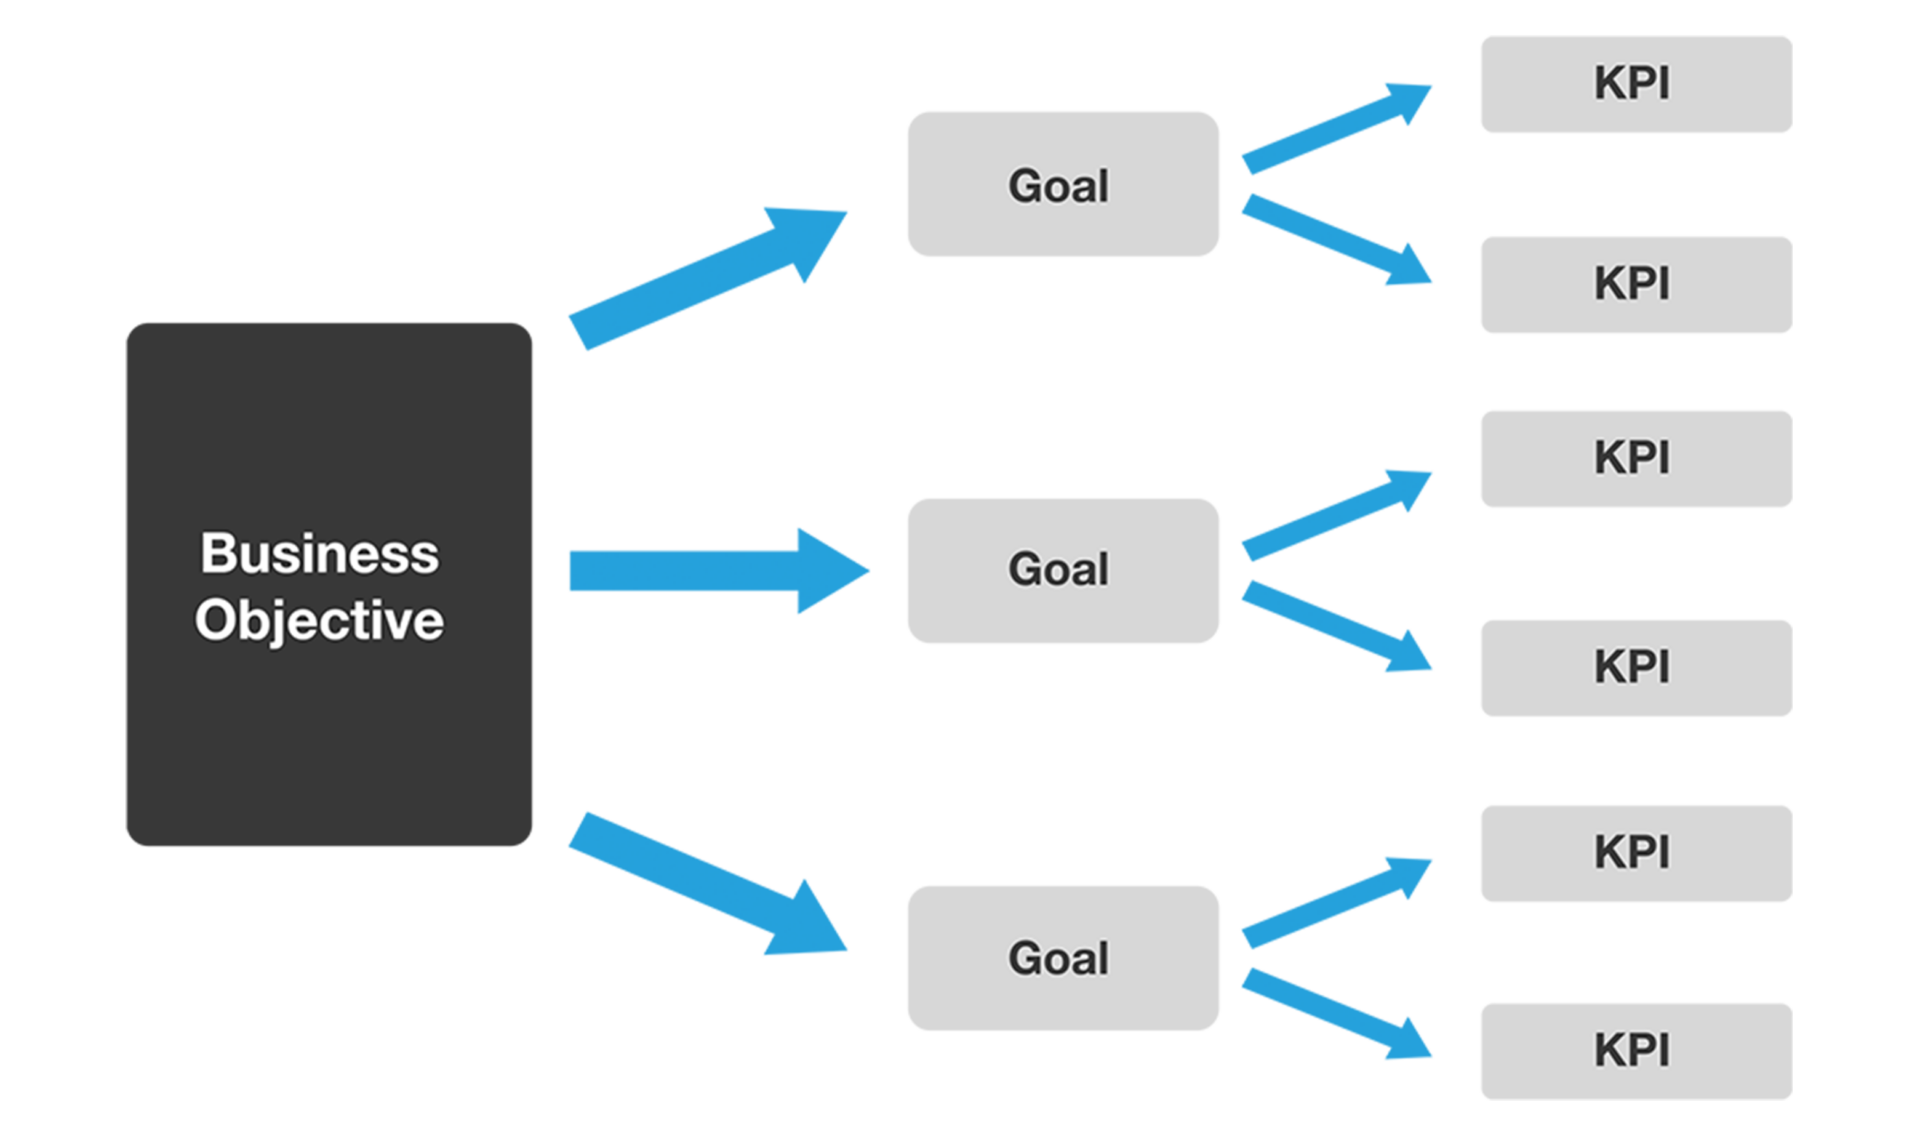
The term “KPI” (key performance indicator) has become increasingly popular in recent years, and for good reason. KPIs are really the heart and brain of an organization: when all is said and done and the dust settles, KPIs show where your organization stands in relation to its goals. Taking the time to write these metrics down is the single most important thing an organization can do when starting to think about analytics tracking.
Starting with objectives, an organization needs to understand and define the main purpose of its digital presence. I usually look for a primary, secondary, and tertiary objective, plus a few others that support the first three. As an example, your list of objectives might include providing a way for users to buy a product, sign up for a government program, or digest information on specific topics.
Once you’ve determined your objectives, you can then outline the goals that those objectives will help fulfill. Examples include increasing the number of online purchases, increasing form submissions, or maintaining a bounce rate within a certain range.
Based on these goals, you can then determine which key metrics will tell you if the goals have been achieved or how close you are to your targets. For example, your key metrics might include the number of transactions, the number of form submissions, or the bounce rate.
Ideally, this process should allow you to narrow down your KPIs to a manageable number. I usually aim for no more than 1-2 metrics per goal and no more than 2-3 goals per objective, with about 5-7 key objectives. This will give you enough data to gain a comprehensive understanding of the purposes your digital presence serves, without suffering from information overload.
Prioritizing What Data to Track
Even after you identify your KPIs, it’s important to track additional supporting data that will aid those KPIs and broaden your ability to paint a more complete picture with the data. While too much curiosity can lead to over-tracking, it’s natural to be curious about how users interact with your digital touchpoints. Take the time to write down what you’re curious about, then go back through and prioritize items on your list by sorting them into three buckets: crucial data, aiding data, and curiosity data. Crucial data is generally made up of your KPIs—the data points that drive your organization. Aiding data consists of data points that will complement your KPIs by allowing for deeper analysis and bigger-picture views of those crucial metrics. Curiosity data is made up of “nice-to-haves”—things that you or your team might be curious about, but that won’t put a damper on progress if you don’t track them right away.
Prioritizing this list will help you determine where to focus your tracking efforts first and what can be addressed later. As a result, your organization will avoid spending time and money tracking data points that may not be used or may become obsolete down the road.
Iterative Analytics Tracking
Learn from the past, look at the present, and iterate in the future. When an organization grasps for data perfection right out of the gate, teams default to the “track everything” mindset to ensure they gather all the data they can possibly get. This reasoning typically stems from fear of the unknown. By tracking everything, organizations assume they’re future-proofing their data—but in reality, they’re spending valuable resources gathering data that might be misused or never analyzed at all.
As business needs and digital functionality change, analytics should change with them. Organizations can’t always predict what data they’ll need in the future—and while it’s important to ensure your tracking remains helpful in the long run, it’s equally important to understand that analytics can be iterated on as your organization’s data needs change. By focusing on key areas and iterating on tracking as needed, organizations can avoid the unnecessarily high costs associated with collecting and storing excess data.
An organization isn’t data-driven simply because it tracks everything. In fact, tracking everything indicates a lack of the awareness and effort required to become a truly data-driven organization. To achieve this, organizations must engage with the past, present, and future:
- Learn from past data to grow in the present and the future.
- Use data from the present to pivot for maximum future gains.
- Iterate on data in the future to keep pace with changes in the organization.
Become Data Literate and Get to Know Analytics Tools
You don’t need to limit yourself to core analytics platforms like Google Analytics and Adobe Analytics while on your data journey. These tools may represent the bulk of your analytics implementation and serve as the backbone for your data needs, but there are tons of other tools that can be used in conjunction with these platforms. One example is Hotjar, a tool that can provide heatmaps of your organization’s website pages with screen recordings of the user’s mouse movements to help you better understand the numbers provided by your other systems.
Additionally, while quantitative (numbers-driven) data is vital for data collection, qualitative (user-driven, voice of customer) data can put these numbers in perspective. Numbers can tell a strong story, but direct feedback from your customers will paint the most vivid and realistic picture of how well your organization’s digital touchpoints are performing. Surveys, polls, ratings and reviews, and Net Promoter Score (NPS) questions are just a few ways to gather qualitative data, and there are plenty of tools to help you in the process: options include Qualtrics, Hotjar, and Survey Monkey, among numerous others.
A/B testing and personalization tools can also aid in understanding an organization’s data and its users. A/B testing tools like Optimizely and Google Optimize allow you to run various tests to determine which of a series of designs is most attractive to your users, which copy will encourage the most clicks, and so much more. Personalization tools like Dynamic Yield and CMS systems like Sitecore allow for real-time personalization of site content to different users, ensuring that users get the right information at the right time and helping organizations to optimize positive user experience and conversions.
Numbers can tell a strong story, but direct feedback from your customers will paint the most vivid and realistic picture of how well your organization’s digital touchpoints are performing.
Upon bringing these additional tools into the mix, an organization may find that it’s unnecessary to track quite as much data they had originally planned with just the standard quantitative tracking platforms in mind. Implementing qualitative data tools can help clarify the purpose of the quantitative platform and, in doing so, guide your organization’s focus towards tracking the most important metrics and dropping those that aren’t necessary. These tools can broaden your organization’s ability to view and analyze its data, leading to a stronger understanding of your end users and their experiences with your brand.
Remember, it’s important for your team to learn the terminology used within the platforms your organization employs. Knowing how a given tool calculates certain metrics, and understanding the nuances of how it processes and tracks data, can help your organization judge when it’s appropriate to track certain things and how to interpret the data once it’s in the platform. This knowledge is crucial for long-term success, and for making the most of the data that you’re collecting and reporting on.
Weed Out the Junk: How to Get Over the “Track Everything” Mindset

Tracking everything usually results in an overwhelming amount of data, leaving analysts wondering where to start and establishing a steep learning curve for new employees trying to understand how and why certain data is tracked. If this scenario describes your organization, it’s time to weed out the junk and bring clarity to your data. Here are some practices that can help you reduce data clutter, filter out the noise, and gain more meaningful insights from your analysis.
Track with Purpose
Be purposeful and strategic in your tracking, and ensure that each metric your organization tracks is tracked for a reason. Ask yourself and your team: how will we use this information, when will we use it, and how can it help us answer key questions or improve the organization? Having a strong understanding of your organization’s KPIs is the first step in creating a robust data profile that will set the organization up for success.
While it’s true that you can always add tracking later, it’s typically not possible to get historical data this way—a fact that further underscores the importance of putting in the necessary time and effort early on to establish a strategic plan for your tracking journey. The point isn’t to track everything “just to be safe”; what matters here is that you’re strategic with your tracking. Devoting time to understanding your organization’s true tracking needs in the beginning will help you deliver what’s needed without opening your team up to data overload.
Track with Understanding
In many cases, the people making the tracking decisions aren’t the ones who have to report on the data. Sometimes these decisions might be made by someone who doesn’t truly care about the data points; often, they do care but have only considered the small subset of data required for their needs and may not understand the broader data needs of the organization. Before deciding on what to track, don’t just talk to your own team: talk to other teams within the organization, as well as higher-ups who might be able to offer a different perspective on what the organization needs..
It’s important to understand what the marketing team needs to know in order to improve their campaigns, as well as what the UX design team needs in order to improve the user experience across your organization’s digital touchpoints. By talking to the various teams within an organization, business stakeholders can stay informed about what’s being tracked and reported on. This can also help in weeding out data points that stakeholders previously believed to be important, but which have in fact gone unused in current reporting. Keeping this line of communication open allows stakeholders to get the most out of the analytics tracking efforts from day one.

Track with Agility
Analytics is an iterative practice: as changes happen within the business, analytics can and should be adjusted to fit the organization’s new needs. With each iteration, stop tracking data points that are no longer important; track only what is crucial to the business right now, and update as time goes on. Reviewing your analytics setup and your KPIs once a quarter is a good way to regularly evaluate what tracking is still needed and what’s no longer applicable, as well as identify things that are broken or otherwise need tweaking to meet your organization’s new needs.
Part of being agile is being proactive instead of reactive. No one wants to open up their reports to find that they’re missing critical data points from the past 6 months, and regularly taking time to review your organization’s analytics setup and KPIs will reduce your risk of running into disasters like these. Doing so ensures that crucial data is collected, while preventing your team from defaulting back to the “track everything” mindset.
Being agile with analytics is the best way to get the most out of it. Analytics implementations aren’t a “set and forget” task; they require regular maintenance and attention. Iterating on your organization’s implementation will help to ensure that you don’t miss out on critical data, while also saving your team from the perils of data overwhelm.
Start Tracking for Optimum Success

Sometimes stakeholders get so caught up in their curiosity about what’s going on that they lose focus on what they really need to see and understand. The “track everything” mindset has become commonplace as conversations around technology advancement, personalization, and privacy laws change. Data is a phenomenally popular buzzword, so there’s a tendency to assume that more is always better. However, this mindset can create more barriers than doors. To find the data tracking “sweet spot”, an organization must define KPIs, use them to prioritize data points for tracking, iterate and adjust regularly, and put real effort into learning more about analytics tools and processes. In other words, organizations need to think strategically if they want to get the most of the analytics tracking tools and methods available to them. It’s time to get out of the “track everything” mindset and start tracking for optimum success.
We hope this helps you along your data tracking journey. Still have questions? We’d love to hear from you! Request a consultation today to hit the ground running and get started on your organization’s strategic tracking plan.


If you have questions or you’re ready to discuss how Blast can help you EVOLVE your organization, talk to an Analytics Consultant today.
Call 1 (888) 252-7866 or contact us below.


