Analytics Blog

Embracing Change: GA4 is Here to Stay
As Google announced the sunsetting of Google Analytics Universal in March, many companies are now facing questions they haven’t had to face in many years. How fast can we get this new platform up and running? Do we stay with Google Analytics or move to a new platform such as Adobe Analytics? The number of questions only grows as they find out that GA4 isn’t a simple migration but a full new implementation, meaning no historical data and the changing of terminology, reporting interfaces, and more. Companies now have to wonder: How much will the switch cost? Will Google Analytics 4 (GA4) support my analytics needs? Is the new implementation of GA4 worth the cost and effort versus going with a different analytics vendor?
These are all great questions, and while the answers to most will depend on the company, one thing is clear: things are about to change. When considering all the factors involved in the questions above, here are five reasons the switch to GA4 can be a positive one.
One: Take advantage of Google Analytics 4 (GA4) Parameters to Enhance Your Analytics

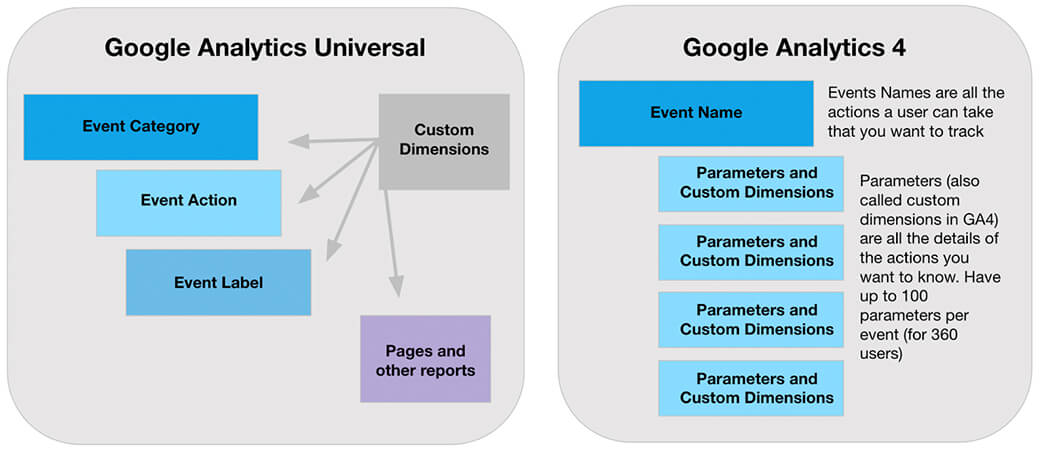
Event category, action, and label were the bread and butter of tracking the custom interactions your users have on your website or application. These were great, as they provided you a way to capture what the user is doing and details about that action; however, this hierarchy is very limiting in how much data you can truly collect. The naming conventions were also a catch-all for too many actions and details, making it hard to distinguish which details corresponded to which actions without intimate knowledge of the site and analytics tracking architecture. To help, many people turned to applying custom dimensions to the various reports, using custom code to string two or more values into the event action or label (separated out by various characters such as dashes, colons, semi-colons, etc.), or both. This could make the data hard to read in the reporting interface, with many choosing to export the data to a separate system to parse the values out into separate line items. As a result, someone new to the company or reporting tool won’t always know what the values represent – since event category, action, and label could be a multitude of various data points based on the tracking setup and user interactions.
A common mistake we sometimes see is taking GA universal tracking and mirroring it to GA, using the exact same tracking methods and sometimes even using event_action or event_label as a parameter name.
GA4 is doing away with event category, action, and label, and instead using custom naming conventions that users can tailor based on their business, website, and/or application. Event category and action are now replaced with custom-tailored event names. For example, an event category of “top navigation” with an event action value of “click” in GA Universal would simply become an event name of “top_navigation_click” in GA4. These new data fields are called parameters and are noted in the GA4 interface as custom dimensions with tailored names for the detail you want to see. For example, what might have been an event label value of “about us” in GA Universal, will become a parameter (or custom dimension) called “navigation_item” with a value of “about us”. If you think of events as actions your user takes on a site or app, parameters are all the details you might want to know about that action.
A common mistake we sometimes see is taking GA universal tracking and mirroring it to GA, using the exact same tracking methods and sometimes even using “event_action” or “event_label” as a parameter name. While your current tracking may be working well for your business objectives, doing things this way means you won’t be taking advantage of what GA4 can bring and are missing out on an opportunity to go from good to great reporting.
Why are custom event names and parameters in GA4 better than using event category, action, and label in GA Universal? Aside from a more tailored name that can make data literacy of the analytics much quicker to achieve and cleaner to report on, you have much more flexibility with how you view and report on the data.
While the out-of-the-box hierarchy of event category, action, and label were nice to have in GA Universal, GA4 offers more flexibility when it comes to viewing all the details of a user action. With the ability to add up to 25 parameters for each event (100 for the paid version), you can see a wider range of data points, and can slice and dice them however you like in the reporting.
For example, imagine a scenario where you have an interactive map and you want to see which place a user zoomed in on most, and which zones were zoomed in on the most. In GA Universal you’d most likely start by either:
- Creating an event with a category of “interactive map”, an action of “zoom”, and a label of “the place”, then creating a custom dimension for the zone numbers, or…
- Having the zone and the place pushed into the event label (zone.place)
For reporting you’d need to either go to two different places to see the data (events for the places most zoomed, and a custom report for zones) or you’d need to use filtering in the event table to see what you’re looking for. With GA4, by using an event of “interactive_map_zoom” and parameters of “place” and “zone” you can now see in one report the top places zoomed in on and the top zones zoomed in on – without the need to parse things out or use filtering.
While the out-of-the-box hierarchy of event category, action, and label were nice to have in GA Universal, GA4 offers more flexibility when it comes to viewing all the details of a user action.
This isn’t to say you should throw your current analytics implementation out the window; but use it as a base for your GA4 implementation rather than as the playbook. Take your current implementation and build from it, taking what’s working for your company and enhancing it with purposeful collection of user interaction details.
By allowing users to go deeper into the data with a larger understanding of the data presented to them, GA4 parameters give companies the ability to become their own analysts. While there may be a learning curve to understanding what parameters are and how to best utilize them, they allow companies to get more information about user behavior than ever before – all while still allowing the company to tell Google just how much of that information they want to look at and digest at one time.
Two: GA4 Offers Greater Flexibility for Reporting and Richer Analysis Tools

Those who are familiar with GA Universal know the out-of-the-box reporting was a major selling point for the platform. However, its visualization and ability for quality analysis was less than ideal, forcing most companies to bring the data into other visualization tools to help with analysis. GA4’s explorer reports give you deeper abilities to slice and dice your data as you need. With the ability to use custom templates for visualizations or use a more free-form option, GA4 allows companies to answer more of their burning questions right in the reporting interface. Even more, while some of these visualizations were previously available only to GA360 customers, GA4 allows standard (non-paid version of the platform) users to create these visualizations as well.
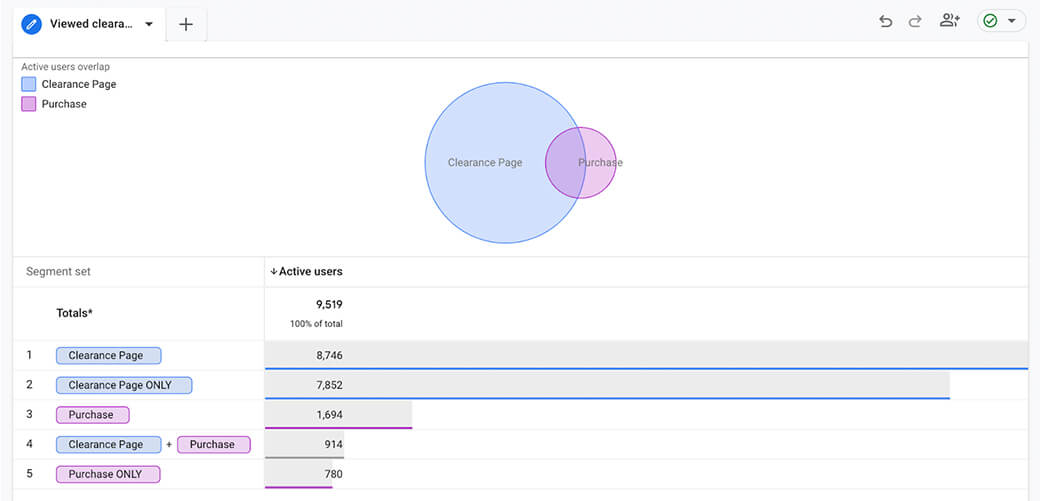
Want to see how many users viewed a certain page, then made a purchase at some point in the future? Create a segment overlap using one grouping of users who viewed that page and another grouping of users who made a purchase. From there you can see how many users of the two groups intersect, how many users viewed the page but didn’t make a purchase, and how many users purchased but didn’t see the page.
The graph below shows a segment overlap of those that viewed the clearance page and those who eventually made a purchase (clearance purchase or non-clearance purchase).
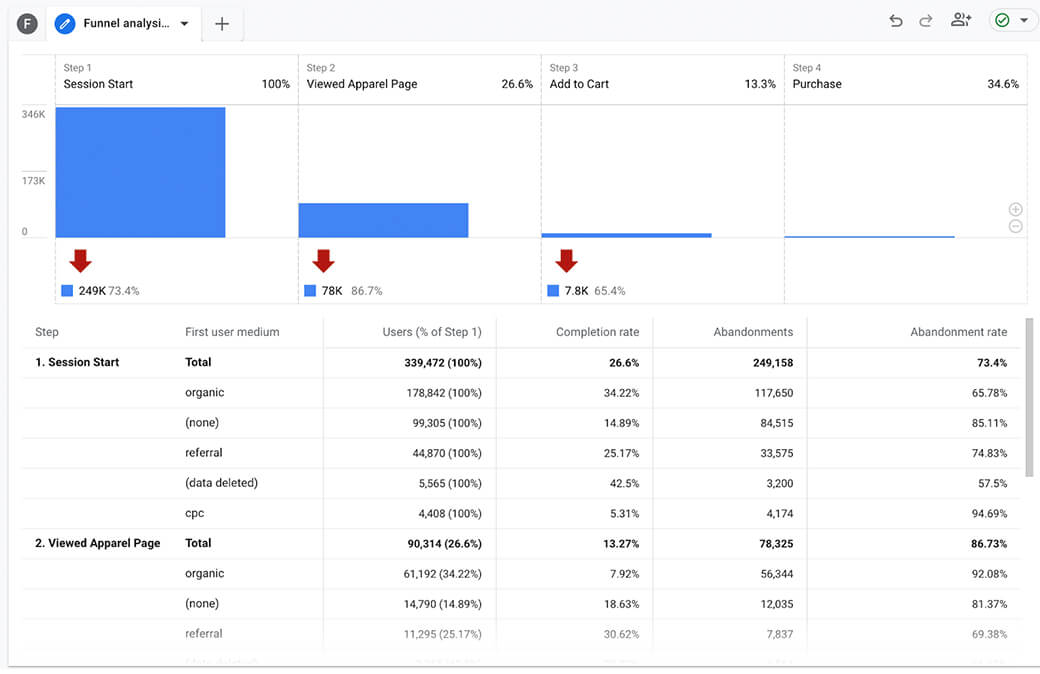
Want to see a funnel of users who worked through an application process? Create a custom funnel that allows you to see how many users flowed through each step and the number of users dropping from each step of the funnel. Further tailor the funnel to see users who joined the funnel from step 3 instead of step 1, or tailor the funnel to see only users who accessed the funnel from a mobile device. You can even add an “elapsed time” metric to see how long it took a person to move from one step to the next.
The funnel below shows a custom 4-step process from when a session was started to when a purchase was completed.
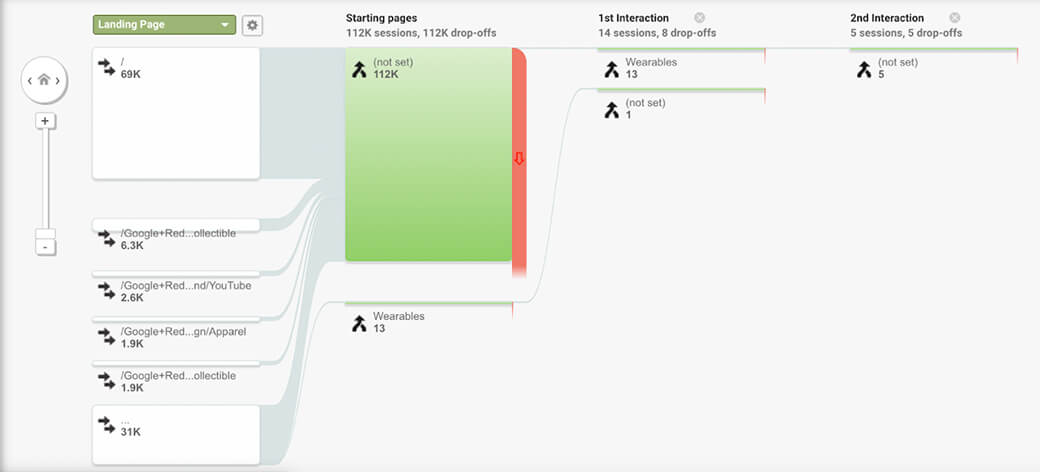
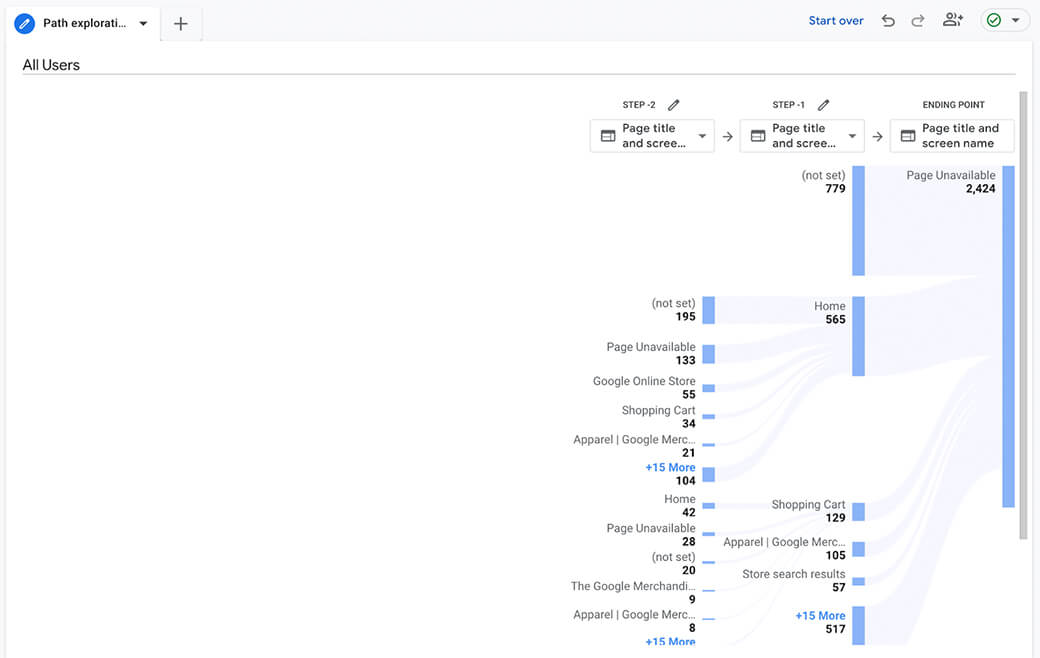
Additionally, GA4’s visualization tools allow for things that aren’t possible in GA Universal. One awesome feature is the ability to see backwards pathing. You can now see a user journey from the viewpoint of the destination rather than only from the starting point..
The flow below shows the landing page the user accessed, then where they went from there.
The flow below shows the pages a user viewed before they got to a 404-error page.
Three: Great Perks that Aren’t Just for Paid Users

In the free version of GA4, Google is introducing some great features that were either previously limited to paid Google Analytics users, or are new but with a premium feel to them.
Previously only available to paid users, the ability to connect to BigQuery now allows users on the free version of Google Analytics to take the advantages offered by parameters even further. While there are limitations to the number of parameters you can register as custom dimensions in the GA4 interface and the number of parameters you can link to an event, BigQuery allows you to send even more parameters of data to be queried and processed for reporting. This is a huge benefit to those who may want more details about a user’s action than what the GA4 interface allows for, but who can’t afford to pay for the upgraded data collection limits allowed for in the paid version.
Analysts now have the power to change report titles for clearer meaning, create a custom collection of reports that can be added to the navigation for quick access, and even manipulate the metrics displayed and visuals used in some of the canned reports.
In addition to the BigQuery connection, another great feature of GA4 is the ability to tailor the left-hand navigation of the out-of-the-box reports, and even some of the reports themselves. This wasn’t an option in GA Universal. Analysts now have the power to change report titles for clearer meaning, create a custom collection of reports that can be added to the navigation for quick access, and even manipulate the metrics displayed and visuals used in some of the canned reports. This flexibility allows analysts to tailor the experience in the GA user interface to what works best for their company, whether by creating clearer report titles or tailoring reports to show users the data they want in the format they want it in. GA4 may require some additional setup beyond what was required by GA Universal, but the benefits of these custom setup options will be well more than worth the time it takes to set them up. This feature is available on both the paid and free versions of GA4, allowing everyone greater flexibility and an upgraded feel.
Four: Google Has Enhanced the Data Quality for Some Key Metrics

There are three metrics in GA Universal that always had some issues: bounce rate, time on page, and sessions.
Bounce rates are generally used to see how many users aren’t actually interacting or engaged with your content. However, they have to be taken with a grain of salt. A high bounce rate isn’t always an indicator of bad design or bad traffic. Depending on the type of content, a high bounce rate can be completely okay. Consider the example of a state government website where people can subscribe to email alerts that indicate if the state flag should be at full- or half-staff. These email alerts contain a link to a webpage that details why the flag may be ordered to be at half-staff. A user’s purpose in visiting that webpage is to get the information and then resume their normal daily activities. This type of page is bound to have high bounce rates, but that’s perfectly normal when we consider the type of content and the objective of the page.
You’ll need to resist the urge to compare the metrics between GA Universal and GA4, which will never be an exact match as the systems fundamentally collect the metrics differently.
In GA4, Google is taking these use cases into consideration. Bounce rate is no longer a metric in GA4 (although it could possibly be added back in at some point in the future). Instead, you’ll find an engagement rate, which is essentially the opposite of a bounce rate. This engagement rate is based on the number of sessions that were deemed “engaged sessions”. An engaged session is determined by one of three criteria:
- The user stays on the page for a certain amount of time (defaults to 10 seconds, but can be adjusted to as high as 60 seconds in 10-second intervals)
- The user has more than one pageview, or…
- The user completes a conversion event (configured by the business based on business objectives).
This means that in the flag status scenario, those users who actually read the content of the page (generally taking longer than at least 10 seconds to read), would no longer be considered a “bounced user”. This makes the data more accurate by taking in all scenarios that the previous metric of bounce rate missed, while still allowing the company to determine parts of its configurations.

Time on page was another metric that wasn’t always accurate. Due to the way Google was calculating the metric, they were unable to get a time stamp on when a user actually left the website, meaning the last page viewed didn’t actually get a “time on page” metric associated with it. This won’t just skew the results for each page, but also your overall “time on page” metric.
GA4 solves this by using a unique event called “user_engagement”. The “user_engagement” event is triggered by two different interactions from the user:
- When the user moves from one page to another, or…
- When they close or move away from the browser or tab the website was on
The latter gives them the final time stamp that was missing from the calculations in GA Universal, making the “time on page” metric more accurate. This leads to better quality data, which in turn means more accurate analysis of the data.
Sessions in GA Universal came with one particularly controversial trigger: changing a session at midnight. While this trigger can help make sure the user’s session always makes it into reporting, it also leads to inaccurate data since it may show two sessions for a user who in fact only had one session. Google has done away with this trigger in GA4. This may have some small drawbacks, but it will lead to more accurate data – especially when looking at sessions per user.
As with any change, it will take time to get used to these new ways of seeing the data you’re accustomed to. You’ll also need to resist the urge to compare the metrics between the two systems, which will never be an exact match as the systems fundamentally collect the metrics differently. However, the updates to these three metrics will make the switch to GA4 much more compelling and the data in GA4 more accurate.
Five: Opportunity to Change What’s Not Working and Take the Good to Great

An analytics platform change like this one is also the perfect time to take a good look at what is and isn’t working for your company’s analytics needs.
All too often, companies notice that they haven’t truly looked at their analytics tracking, and realize that they forgot to evolve their analytics tracking as their website or application evolved. This leads to data that’s either inaccurate or unimportant. With GA4 implementation, companies are now forced to take a harder look at their data and have a great opportunity to fix these issues. Find data that’s no longer needed or important to know for the business? Don’t track it in GA4. Find data points that are no longer reporting, reporting the wrong information, or not firing appropriately? Update the tracking for GA4 and look for ways to “future proof” the vital data. Find important user actions that never got tracked or were always pushed lower in priority? Ensure it’s captured in GA4.
While an analytics implementation can be time-consuming, it can also provide you with a good opportunity to step back and reflect on your tracking needs. Analytics isn’t a set-and-forget task; it’s a living breathing entity that needs to grow and change as your company, websites, and applications change.
Conclusion

GA4 is different from what the Google Analytics user base has become accustomed to. It requires a mental shift in how you think about your data collection and data structure. However, embracing this change is key to getting the most out of GA4. Use GA4 as an opportunity to evaluate what is and isn’t working in your current analytics implementation.
While GA4 has been out for over a year and a half, this news on sunsetting Google Analytics Universal is prompting many customers to ask, ‘do I need to switch?’ followed quickly by a statement: ‘I have to switch.’ Embracing the change and delving into all of what GA4 has to offer is the best way to understand your data needs, keep your data in tip-top shape, and continue driving towards better quality data. Still have questions? We’d love to hear from you! Reach out to us for a consultation to discuss your needs.


If you have questions or you’re ready to discuss how Blast can help you EVOLVE your organization, talk to an Analytics Consultant today.
Call 1 (888) 252-7866 or contact us below.


