Analytics Blog

Deeper Attribution Modeling with Adobe Analytics
“Attribution modeling” has become something of a buzzword over the past few years. So what is it, really? How can it help you as a marketer? In this post I’ll focus on how we can use Adobe Analytics to answer these questions.
First, let’s illustrate the problem that attribution modeling is trying to solve with the following scenario:
I was recently looking to buy a new hat. So I went online and searched for “Seahawks hat.” There were 871,000 options returned. I clicked through a couple of the links and wound up on the site I would later purchase from. At the time, I did not find the perfect hat; later I was catching up on my sports news and saw a banner ad for that same website. I clicked through and started to browse, but I was short on time and had to leave the site abruptly.
A few days later, I saw a Facebook ad for the perfect hat — a nice snap-back with the old throwback colors. I looked at the web page and decided that was ‘The One,’ but it would have to wait.
When payday came, I searched Google for the website and the exact hat I wanted. The hat appeared in one of the paid search ads, and I finally bought it.
Now putting my analyst hat on (pun intended), which one of those channels should get the credit for my purchase?
A. Organic search, for introducing me to the site in the first place?
B. The display ad, for re-engaging me?
C. Paid social advertising, for delivering the perfect ad for me?
D. Paid search, for making it easy to find the hat again when I was ready to purchase?
The answer is: complicated.
If you just look at the first or last channel I touched on my way to conversion, you will devalue all of the other touch points along the way. To solve this problem, we need to explore...
The Concept of Attribution Modeling
Attribution modeling is an attempt to allocate credit or value to each touch point in a customer’s path to conversion.
Understanding and taking advantage of this concept can help you better determine the influence that each channel has on your bottom-line.
That all makes sense in theory, but how about in practice? Let’s start by looking at two of the most common attribution models used today: Last Touch and First Touch.
In order to better understand the differences between these two attribution models, let’s take the following customer journey as an example:
Visit 1 – Organic Search Non Branded
Visit 2 – Paid Search Branded
Visit 3 – Direct
Visit 4 – Email
Visit 5 (conversion) – Affiliate
Last Touch Attribution Model
Last touch is the most common attribution model used today. The premise is very simple: whatever channel was the last one to bring the visitor to the site before the conversion will get 100% of the credit. There are distinct advantages and disadvantages to this model:
- Advantage – When the visitor came to your site through the affiliate channel on the fifth visit, they were ready to make a purchase. Affiliate should get credit for finding and attracting that customer who was ready to buy. The Last Touch attribution model gives you an idea of which channels bring in customers who are ready to buy.
- Disadvantage – Even though it was affiliate marketing that was able to bring the customer in for the final visit where they converted, it was organic search that initiated contact with this individual. It ignores the fact that your SEO team was able to rank high enough to make it easy for the customer to find the site again, or the fact that your email team was able to nurture the customer and bring them closer to converting. The more touch points that exist between initial visit and conversion, the less accurate Last Touch becomes at allocating credit or value.
In Adobe Analytics Marketing Channel reports, Last Touch is one of the two attribution models that you are able to compare. The campaign reports are generally set to Last Touch by default.
First Touch Attribution Model
First Touch attribution is also a very common model. As the name would suggest, it is the polar opposite of Last Touch attribution. It gives 100% of the credit to the first channel that brought in each visitor.
- Advantage – First Touch attribution helps you understand which channels are successful at bringing in new visitors. In the example above, without a successful SEO strategy, the visitor might have gone to a competitor’s site instead. Organic search played a pivotal role and should get some credit for this transaction.
- Disadvantage – By giving all of the credit to organic search, we are ignoring the fact that the customer did not actually convert for 4 more visits. Without those other channels it is possible this visitor would have moved on to another site. It is important to recognize the other channels that helped nurture and eventually convert the visitor.
There are no default reports in Adobe Analytics that use First Touch attribution. However, if you have Marketing Channels set up, First Touch is one of the 2 attribution models that you can compare.
More About Adobe’s Marketing Channels Reports
The best way to think about Marketing Channels is as a combination of the default “Referrer Types” report, and the “Campaigns” report. For example, in your Referrer Types report you will have the default 4 referrer types: Typed/Bookmarked, Search Engines, Other Websites, and Social Networks. Looking at these reports can be helpful for a very high level view of how traffic arrives to your site, but if you look at it a little deeper you will realize things like:
- contained within Typed/Bookmarked is all of my marketing efforts such as email, text alerts, vanity URL’s, etc.
- contained within Search Engines is both paid and organic search traffic, both branded and non-branded
- contained within Other Websites you have affiliate links
- contained within Social Networks you have both paid and organic social media traffic
If you were to look at your Campaigns reports you will likely see a lot of “unspecified.” Contained within this “unspecified” bucket is everything that isn’t tagged as a campaign (e.g., emails, affiliates, social networks, etc.). Looking at these two reports, it becomes immediately clear that without Marketing Channels there would be no easy way to compare something like: email traffic with referring domains.
Please note:Marketing Channels reports are not set up by default. Setting them up is a very involved process, which should be carefully planned because later changes are not retroactive.
Dive into the World of Attribution
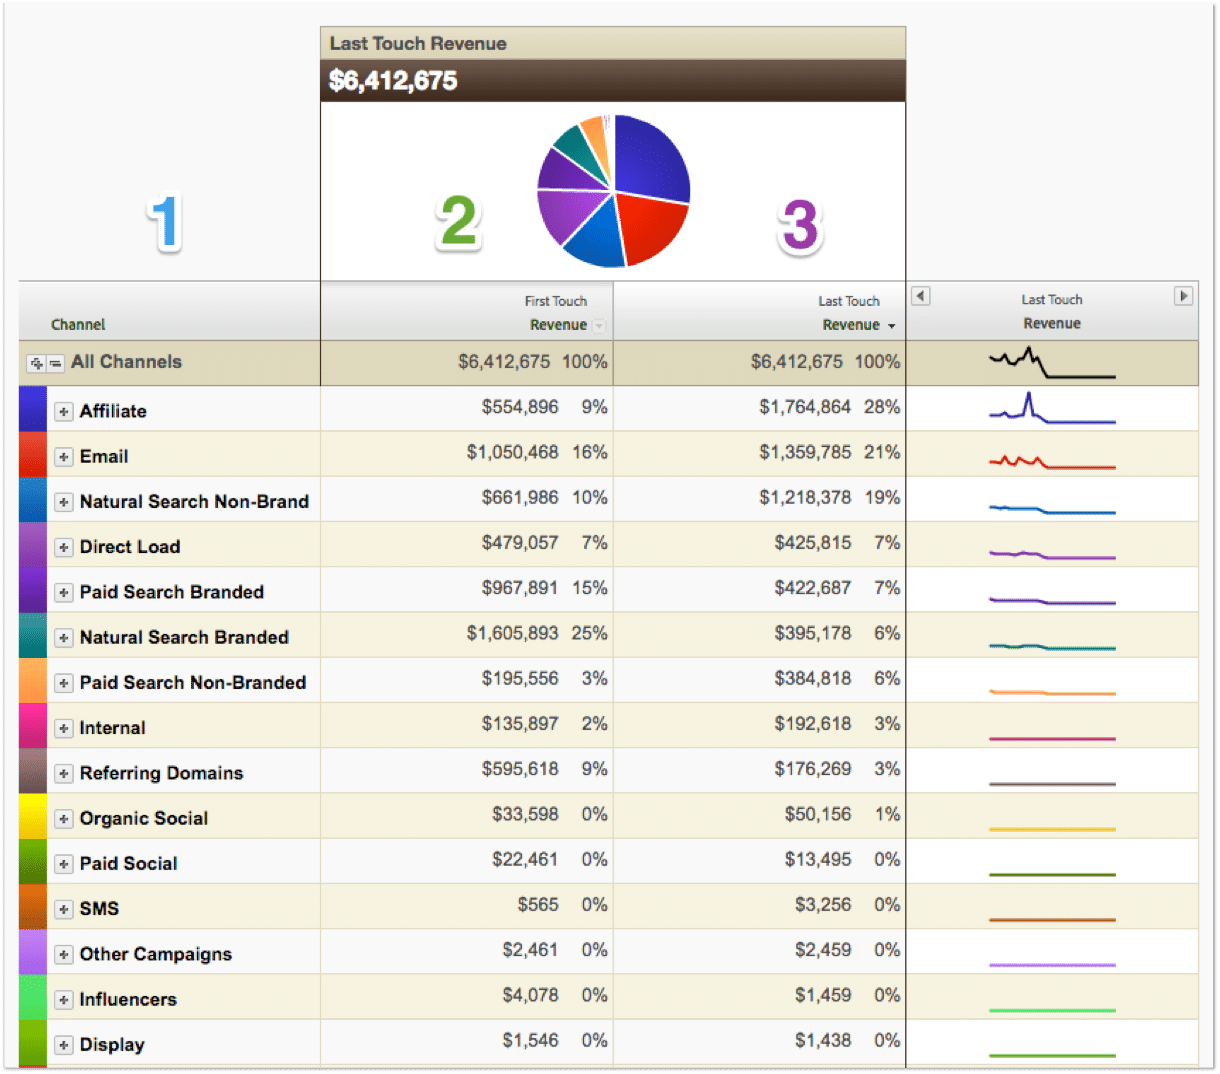
Let’s start with a look at the Marketing Channels Overview report.
There’s a lot going on here, so let’s break it down:
Column 1: The marketing channels that you have previously set up. Your default channels will be Paid Search, Natural Search, Email, Display, Affiliate, Social Networks, Internal, Direct, and Referring Domains, and you can specify up to 25 marketing channels.
Column 2: Here we see how much revenue should be credited to each channel through first touch attribution.
Column 3: Here we see how much revenue should be credited to each channel through last touch attribution.
A quick glance at this report shows that there are some channels that look more or less flattering under the light of first or last touch attribution.
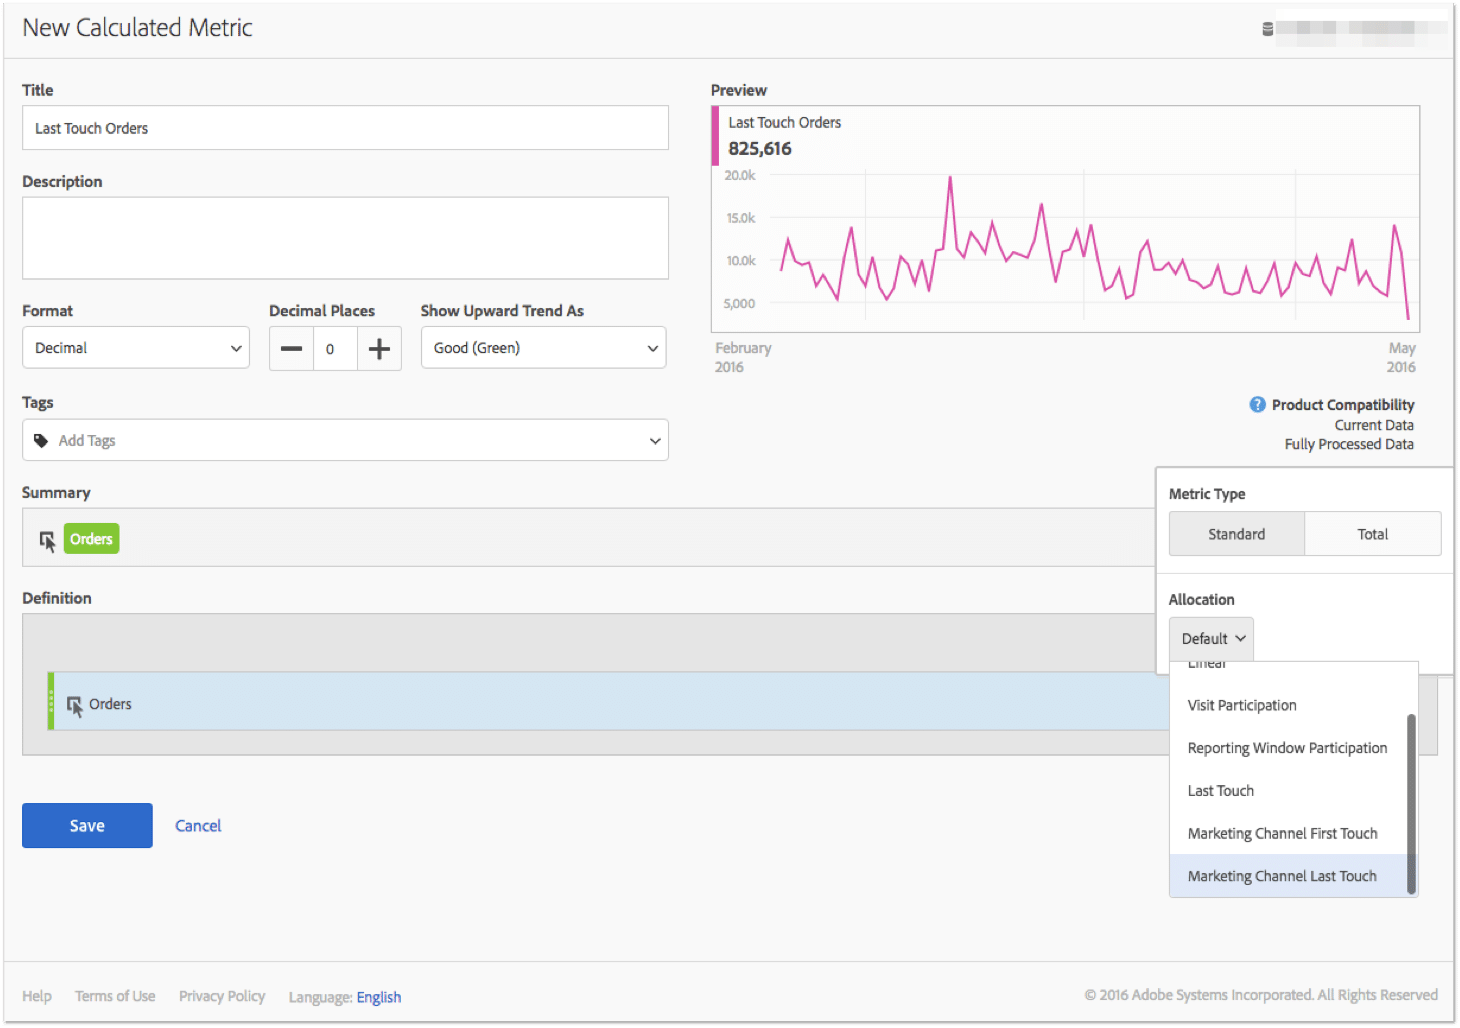
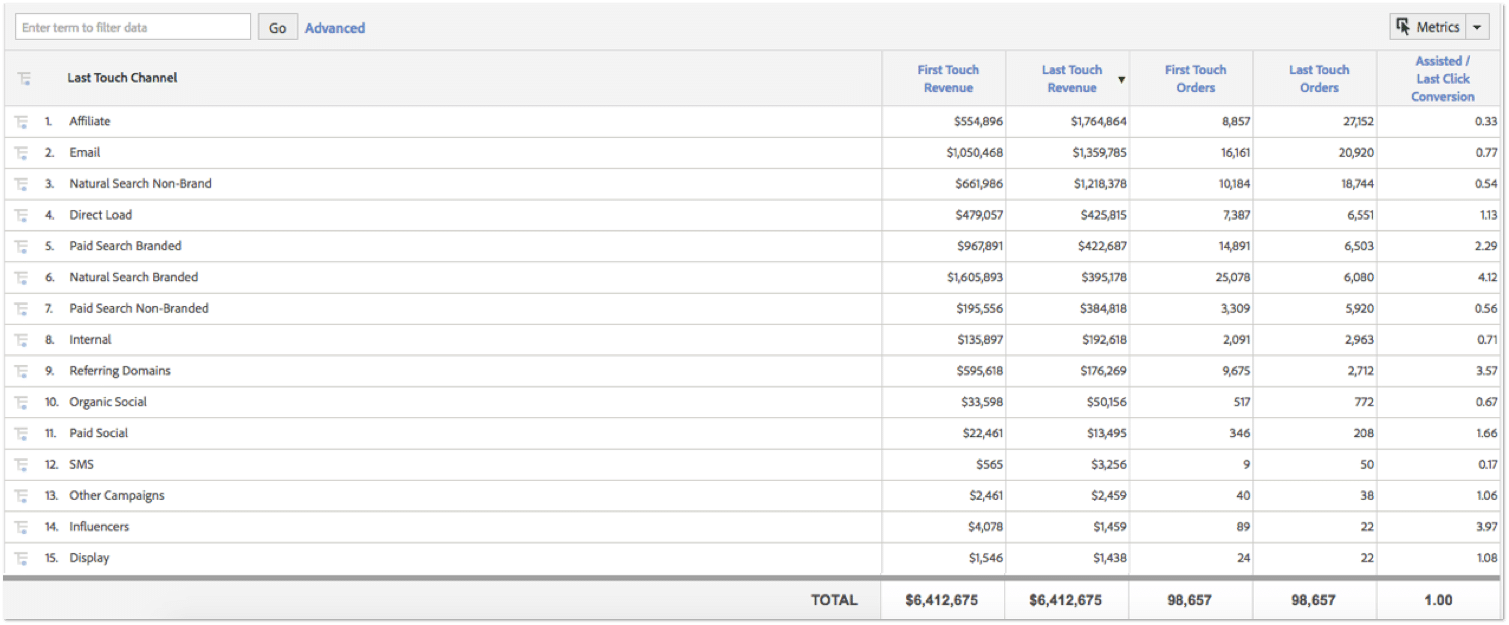
To better compare these numbers, let’s open up the Last Touch Channel Report. Here we’ll utilize Adobe’s Calculated Metrics to create “First Touch Orders” and “First Touch Revenue” metrics.
Finally, use Calculated Metrics again to create the following metric: Assisted/Last Click or Direct Conversion.
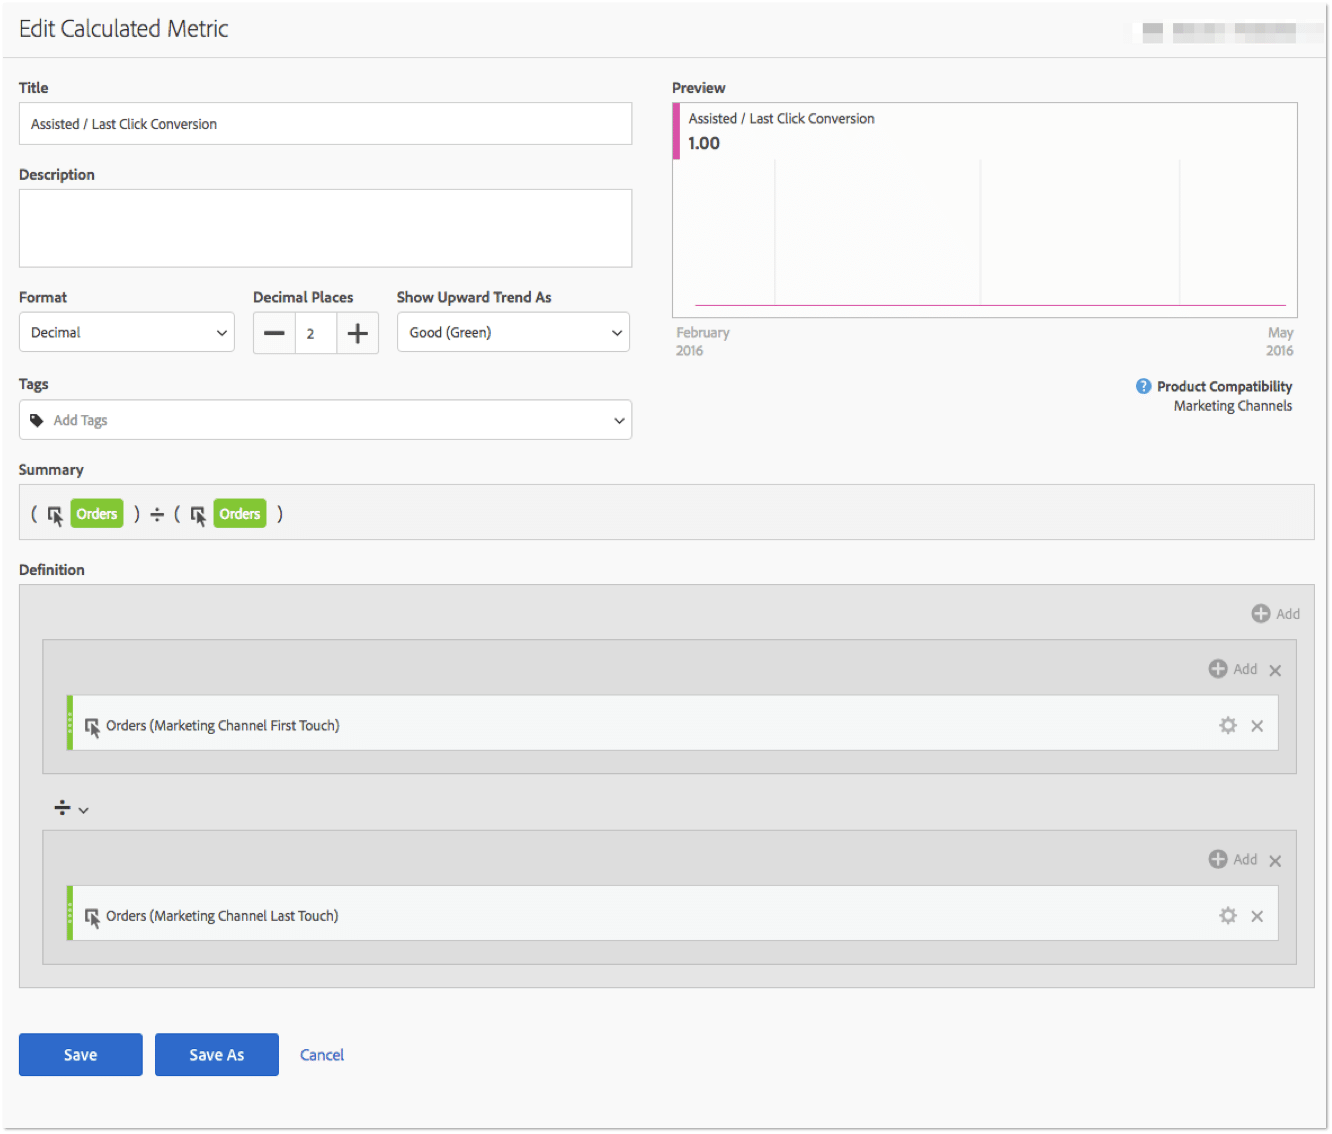
one simple ratio that helps us better understand where each channel succeeds
This new metric condenses first and last touch orders into one simple ratio that helps us better understand where each channel succeeds.
The closer a channel’s value gets to 0, the better that channel is at reaching customers who are close to conversion. A value close or equal to 1 means that channel does equally well at bringing in new customers up high in the sales funnel as it does bringing in customers who are ready to convert down at the bottom of the sales funnel. The further a value is above 1, the better the channel is at assisting conversions and bringing in new customers who are further away from conversion.
With all of these values in one report we now have some brand-new insights.
For example, we can see that based on the ratio of assisted to last-click conversions, Natural Search Branded is a clear winner in terms of First Touch attribution. If we were only looking at Last Touch revenue before, we would assume that Affiliate is our most profitable traffic source and we should put all our money into building that up. However, by doing that, we would be neglecting the fact that Natural Search has done a lot of the dirty work of attracting customers to the site for the first time.
Understanding how each traffic source caters to customers in different stages of the sales cycle is an important insight that we can use to determine what type of content we want to present to visitors from those channels.
For example, through our affiliate channel we can expect to have more success by presenting customers with clear calls to action that point to purchasing products or specific sales rather than reading our blog or getting to know our brand.
Other Types of Attribution Models
Let’s go back to the customer journey example we mentioned before:
Visit 1 – Paid Search Non Branded
Visit 2 – Organic Search Branded
Visit 3 – Direct
Visit 4 – Email
Visit 5 (conversion) – Affiliate
Linear Attribution Model
Linear attribution splits up the credit equally between each of the marketing channels that contributed along the way to conversion. This means in the example above, each channel would get 20%, or one 5th, of a conversion.
- Advantage – Linear is a great way to look at the value a channel brings regardless of its position in the purchase process. It won’t matter if it was the first or last channel, it will get the same amount of credit. This method is an attempt to put every channel on an equal playing level.
- Disadvantage – One potential problem with linear attribution is that it rewards channels that appear in shorter conversion paths more than those that appear in longer conversion paths. This can lead to a situation where a channel that was a part of a two-visit conversion cycle resulting in a $100 purchase reportedly brought in more value ($50) than a channel that was a part of a five-visit conversion cycle resulting in a $200 purchase ($40). Depending on what your business model is, this may be a good thing or a bad thing.
There are no reports in Adobe Analytics that utilize linear attribution by default. But if you would like to view your campaigns in terms of linear allocation and compare that to first and last touch attribution, you can utilize processing rules to copy the values present in the tracking code variable to two other eVars (conversion variables, in Adobese) and set their allocation settings to First Touch and Linear.
Full Allocation Model
Before I go into Full Allocation attribution, I should mention that this is not an actual report in Adobe Analytics that shows full attribution for conversions. Instead, it is a setting for Success Events. When you turn this on, you gain access to another metric.
For example, if you turn on participation for Revenue, you will have a “Revenue” metric and a “Revenue (Participation)” metric. You can use this metric in conversion variable reports, the pages report, and other traffic variable reports for which you have enabled participation metrics.
Full attribution is very similar to Linear attribution but with one key distinction: in linear attribution, each conversion is split up and divided equally between each of the touch points. Full attribution takes that single conversion and gives 100% credit to each of the touch points. In the example given above, each of those 5 channels gets one fifth of a conversion through linear attribution, whereas with full attribution, each of the five channels would get one full conversion.
- Advantage – Much like linear attribution, this model disregards what position the channel came in; it will get 100% of the credit either way. Also, it doesn’t matter how long the purchase cycle is. Channels that are part of long cycles will receive the same amount of credit as those that are a part of short cycles.
- Disadvantage – You may have noticed this already, but if you are handing out 100% participation ribbons to every channel, you are going to be double-counting your conversions. Full Attribution is not meant to be a means of looking at the exact number of conversions each channel was responsible for. Instead it is a way of looking at how many conversions each channel participated in (this is why the metric is called a participation metric).
Attribution Models Not Included in Adobe Analytics Standard
Time Decay
Time decay gives more credit to the channels chronologically closer to the actual conversion. You would want to use this when there are specific promotional periods that you want to give greater credit to.
Position-Based
This is a combination between First Touch, Last Touch, and Linear. With this attribution model, more credit is given to the first and last touch channels, with the rest of the credit distributed equally between the remaining channels.
However, if you have Adobe Analytics Premium, you do have access to more advanced attribution models such as Time Decay, Position-Based, or Data-Driven/Algorithmic.
What is the Best Attribution Model for You?
Let’s start by determining what your typical customer journey looks like in Adobe Analytics.
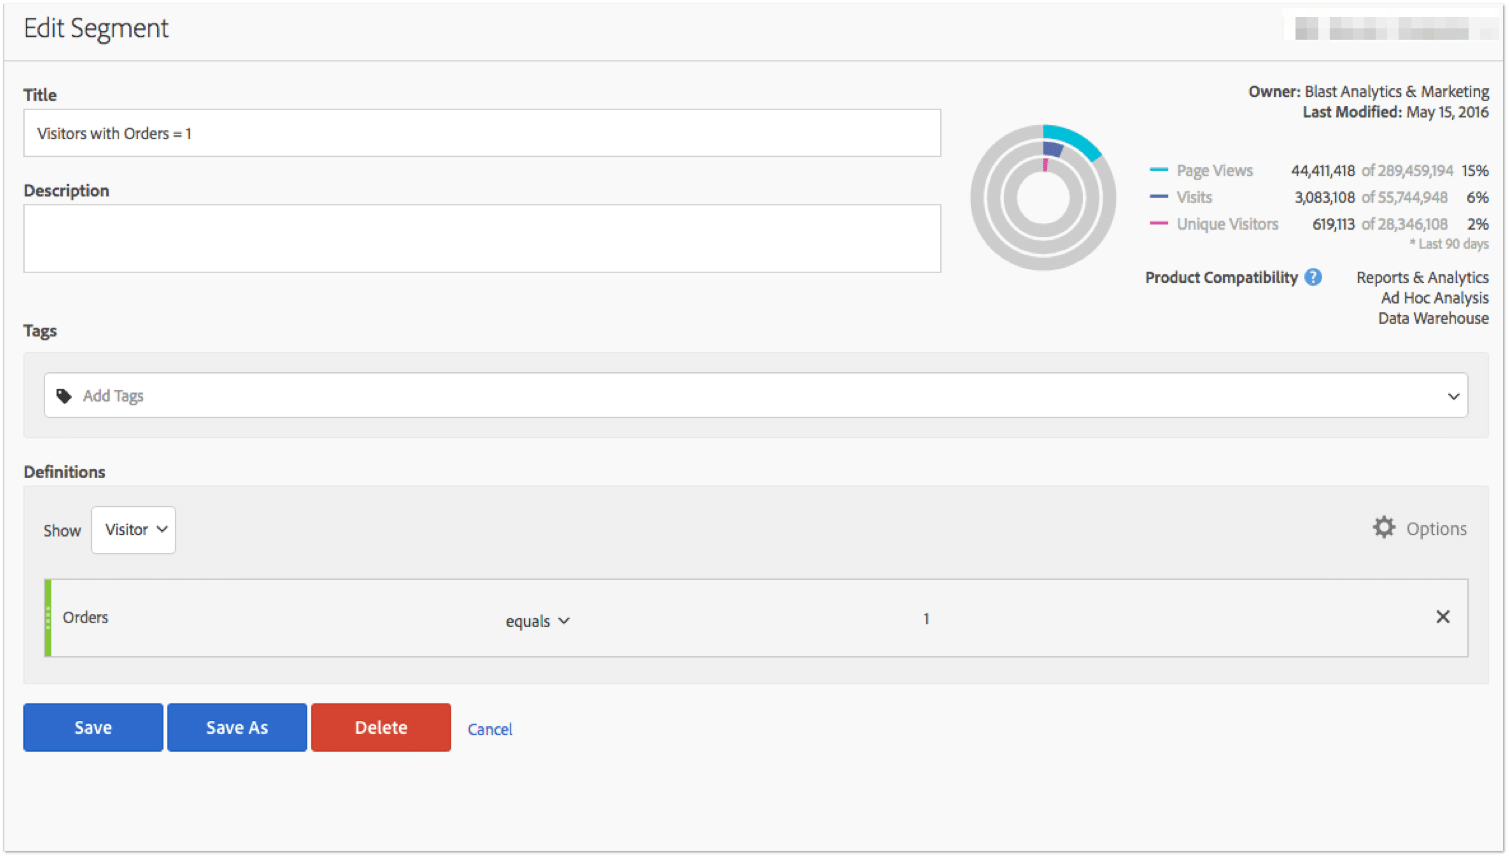
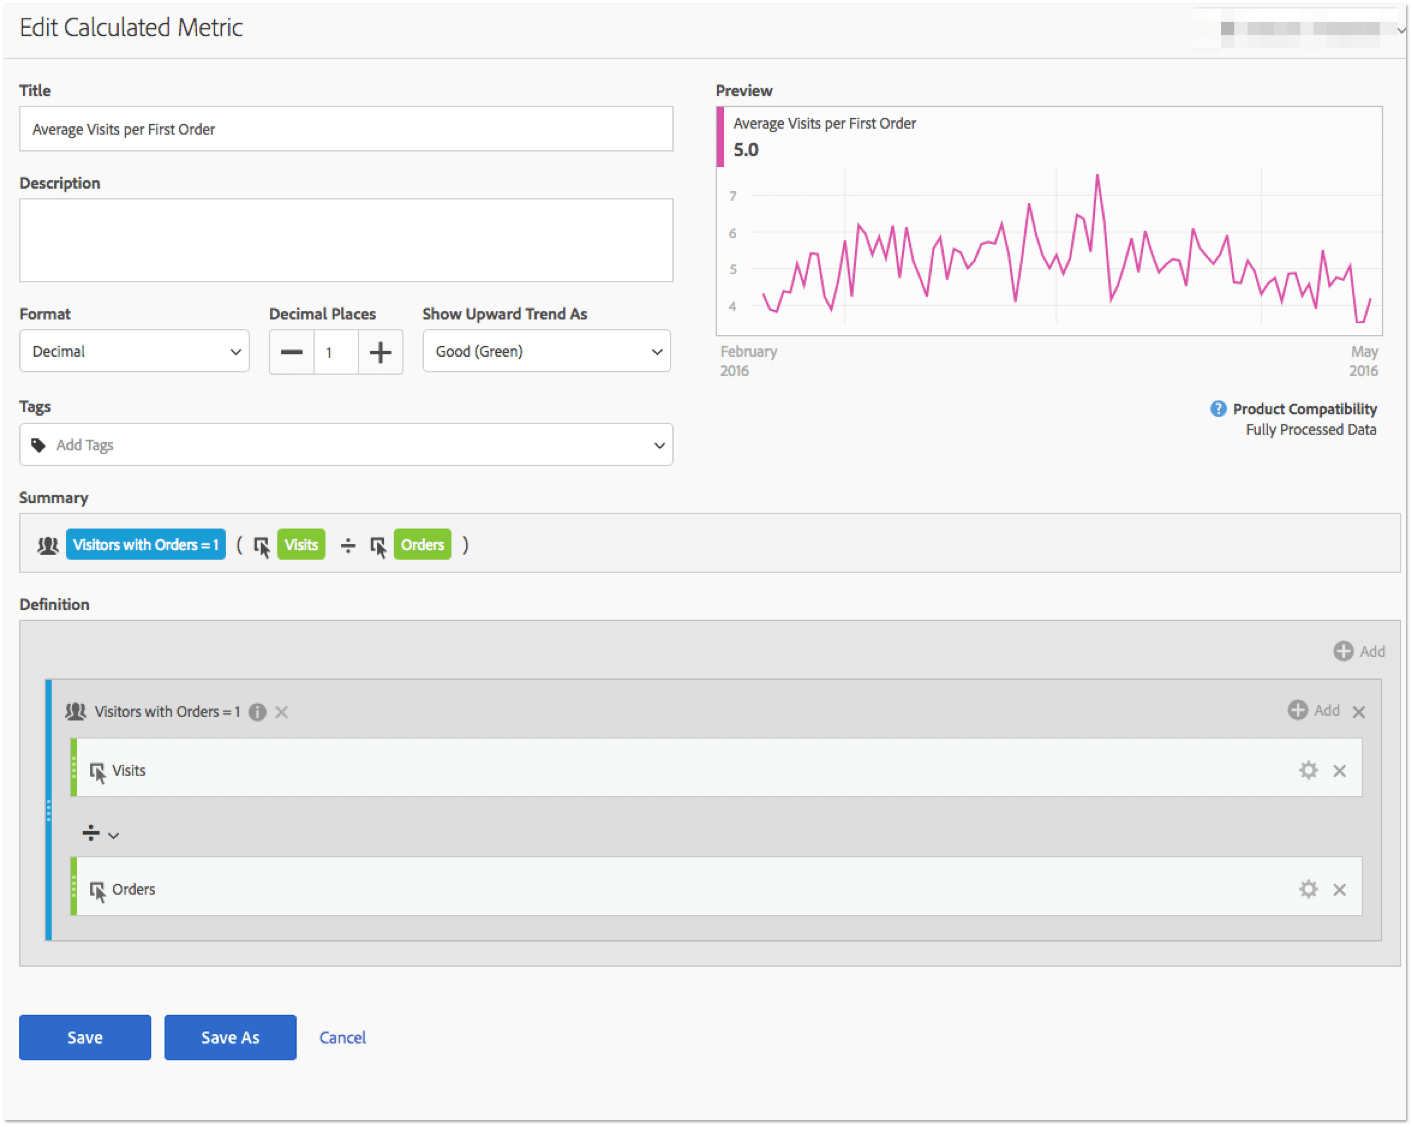
Create a visitor-based segment that says, “orders equals 1.”
This will show us just the visitors that have made their first purchase (with some caveats, which I will address below).
Once you have made this segment, you can create a calculated field that takes Visits divided by Orders. Once you have created this equation, segment it by the “Orders = 1” segment you created.
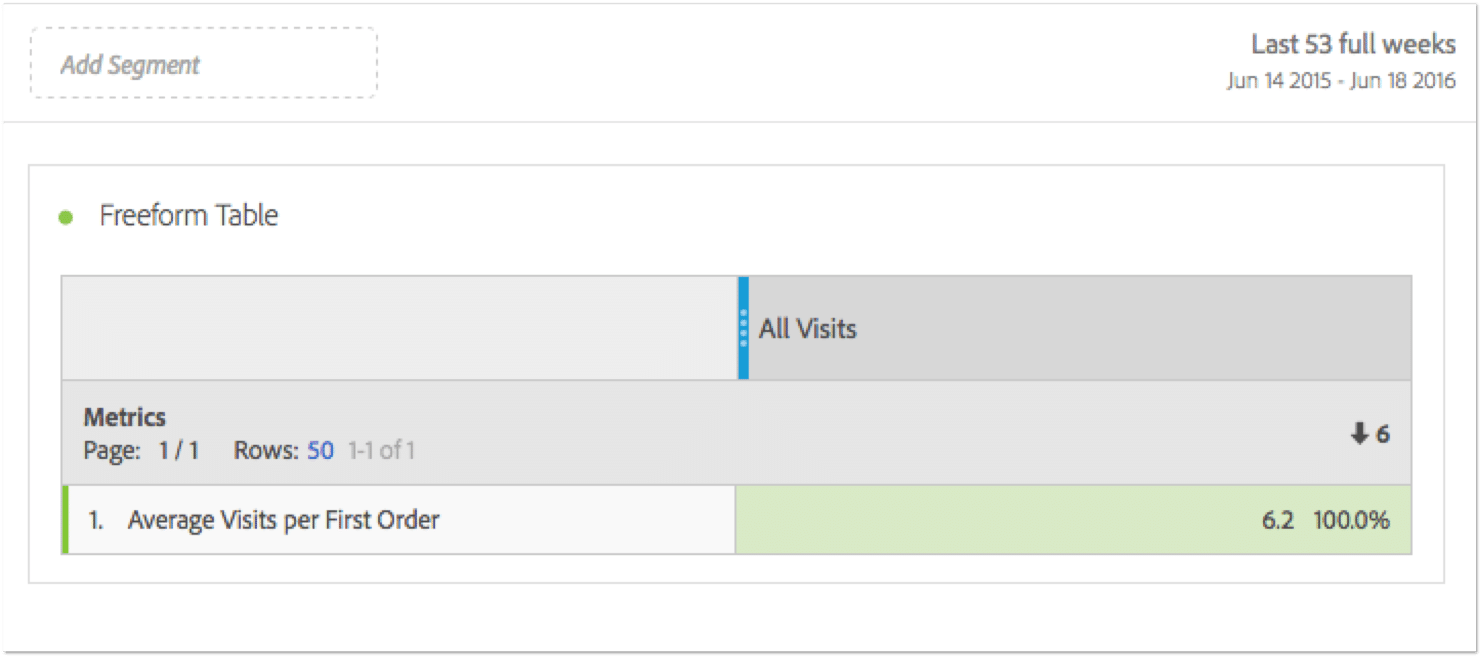
In Adobe’s Analysis Workspace tool, drag the new metric you just created to the Rows section of the freeform table. Now for the caveat I mentioned above: if your date is set to only the current month, your calculated metric is only going to show those unique visitors who have made a purchase in that one-month time frame. Depending on your business, one month might not be ample time for your customers to make it all the way through the purchase funnel from initial visit to conversion.
By only looking at one month worth of data, you are only including those visitors who found your website and were ready to convert right away.
You’ll notice that as you increase the time frame, the Average Visits per First Order will increase. This is because you are giving the unique visitors in the segment enough time to make their way to their first purchase. Think about what your product is and make sure you are giving your unique visitors more than enough time. To be safe you can look at the entire life of your data. With this particular client, I know that one year is plenty of time.
What are we looking for?
- With this metric, we want to determine how many visits it takes, on average, to get a visitor make their first purchase on the site.
What does this number tell us?
- It looks like the average for this website is about 6 visits. This tells us that just looking at the last touch channels will not be enough to fully understand the customer journey.
- To know what channels brought the visitor to the site for visits 1-5, you will need to look beyond last touch attribution.
This is a critical point to call out here. Remember when I was looking to buy a new hat? I didn’t just show up on the site and make an impulse buy. My path to conversion involved multiple touch points along the way. We have just discovered that for this site, most of the customers do not convert on the first visit. In fact, on average they come back at least 5 times before they make their purchase. By using just First Touch or Last Touch attribution, you are failing to give value to 5 out of those 6 touch points.
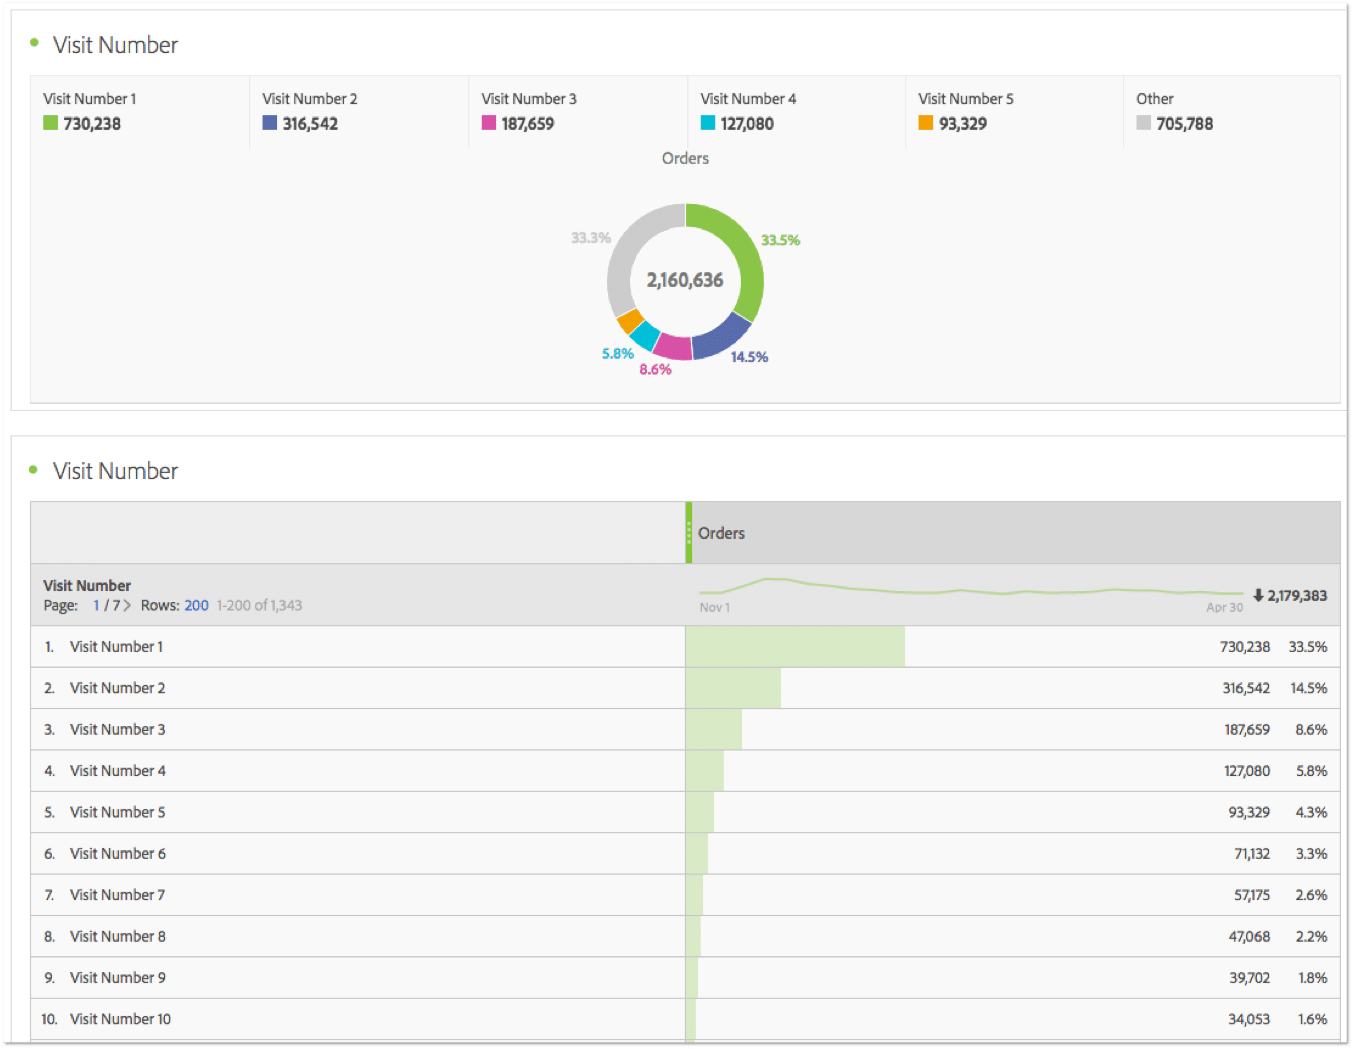
Before we move on, let’s dig in a little deeper. Search for the Visit Number dimension. Drag that over to your freeform table along with the Orders metric and visualize the resulting table with a donut chart.
What are we looking for?
- It is likely that the #1 most common visit number for orders on your site is the first visit. We are looking for what % of orders came on visit numbers greater than 3.
- As you can see, close to 45% of all orders come from visit numbers greater than 3.
What now? We have established that First and Last Touch attribution as seen through the Marketing Channels report will not be enough to fully understand the customer journey.
How to Get a Better Look
Unless you have access to Adobe Data Workbench, the only built-in attribution modeling you can currently report on is First and Last Touch attribution with Marketing Channels. However, it was recently announced at the Adobe Summit that plans are in place for a much more robust set of reports for Analysis Workspace, called X Attribution. These reports would provide a lot more information and appear to be very similar to Google’s attribution modeling reports.
That said, there are a few things that can be done to get a rough idea as to what happens between First and Last Touch marketing channels without upgrading your contract to Adobe Analytics Premium.
I mentioned the first two options earlier when I talked about Linear and Full Allocation.
- Participation Metrics – By enabling participation for your Order and Revenue metrics, you can add the “Order (Participation)” metrics to the Last Touch Marketing Channel report. This reveals how many orders each channel participated in regardless of position. By comparing “Order (Participation)” with Last Touch Orders, you can see how much a particular channel might be undervalued when looking just at Last Touch attribution. For example, you can see that in terms of Last Touch, Affiliate is pretty well-represented, whereas Natural Search Branded is very much under-represented. It is clear that Natural Search Branded participates in a large number of conversions even when it is not the last channel touched.

- Linear Attribution – If you were to duplicate the values in the campaign variable to other eVars, you could set them to expire after the same amount of time as the campaign variable, but then change the allocation to Linear instead of Last Touch. The effects of this change would be similar to using participation metrics, but one key difference is it would only be available for campaign values and not for full channels such as direct, search engines, or general referral traffic. Basically, it will only work for anything that has been tagged with campaign parameters. This may work for some, but others may find it to be too limiting of a solution.
- Cross-Visit Participation Plugin – There is a plugin for Adobe Analytics called “Cross-Visit Participation” (Sometimes called “Campaign Stacking”) that you can use to capture all of the channels that a visitor viewed before converting. On every first page of the visit, a value is set to determine what marketing channel brought the visitor to the site. Each time the visitor returns, the new channel is appended to the previous channels.
Both of the last solutions (Linear Attribution and Cross-Visit Participation) are only options that will work with tagged campaign parameters. However, if you work with your developers, you can have them set the eVars to populate with similar rules to the Marketing Channels Processing rules. This way, you can see Linear Attribution or Cross-Visit Participation based on marketing channels rather than just campaign parameters.
Remember the example we had above? Let’s see how that would work with this Cross-Visit Participation plugin:
- Visit 1 – Paid Search Non Branded
- Visit 2 – Organic Search Branded
- Visit 3 – Direct
- Visit 4 – Email
- Visit 5 (conversion) – Affiliate
In the eVar you would see the following for each visit:
- Visit 1 – Paid Search Non Branded<
- Visit 2 – Paid Search Non Branded>Organic Search Branded
- Visit 3 – Paid Search Non Branded>Organic Search Branded>Direct
- Visit 4 – Paid Search Non Branded>Organic Search Branded>Direct>Email
- Visit 5 (conversion) – Paid Search Non Branded>Organic Search Branded>Direct>Email>Affiliate
In the Admin settings, you should set this eVar to expire on your main conversion point (purchase, lead form submit, etc). This way the eVar will continue to gather marketing channels until they convert.
Venture Beyond Last Touch
As you can see, even though Adobe Analytics Standard does not have access to more advanced attribution models such as Time Decay, Position-Based, or Data-Driven/Algorithmic, there is still plenty of opportunity to better understand how each marketing channel is contributing to your overall conversions.
Using the reports mentioned above, you will be able to successfully look beyond Last Touch attribution and better allocate credit to your marketing channels, as well as understand the paths your customers take to conversion.
