Analytics Blog

Supermetrics for Google Analytics Elevates Your Analysis
As a digital analyst I have worked with a lot of analytics tools. I would like to share the story of my latest discovery: Supermetrics.
It started as an e-commerce client project that turned into so much more. I was using Google Analytics to look at multiple metrics year-over-year for eight countries — across device type, medium and source. I knew how I wanted to see the data, I just couldn’t quite get the level of detail I needed within Google Analytics.
The question in front of me was, “how do I do that in a timely manner and find the insights I need?” This is easily the kind of question an analyst could spend some serious hours on. However, we as analysts need to be detail oriented and efficient.
Enter Blast colleague Halee Kotara who introduced me to Supermetrics, and showed me how to use Supermetrics for Google Analytics.
What a happy day! After 23 years in digital analytics, why was this such a wonderful discovery? Supermetrics is an analytics tool that enables you to quickly pull your Google Analytics data and analyze it in Google Sheets. They bill themselves as a “marketing reporting system,” but with Supermetrics you can create endless automated reports and dashboards, allowing you to build a better story for your customers in very little time.
Simply put, Supermetrics will elevate your Google Analytics analysis in five great ways.
Supermetrics will elevate your Google Analytics analysis!
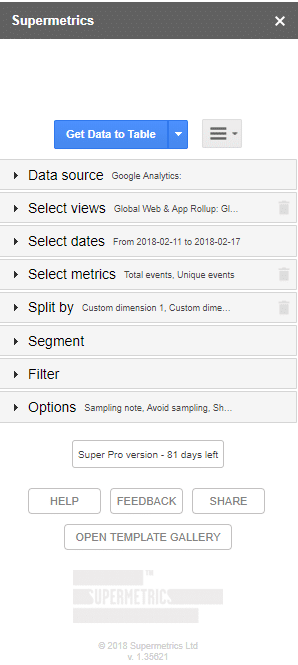
#1) It’s Easy to Install and Easy to Use
It was simple to get working with the data. As an analyst, our time is very valuable. I appreciate anything that allows me to get to my analysis fast. To install Supermetrics, simply download the plug-in for Google Sheets (side note – there is a free trial if you want to kick the tires before you buy). After installing the plug-in, click the Google Sheets Add-Ons menu and you’re ready to get started. My life as an analyst is made easier by Supermetrics integration with Google Sheets which makes it simple to export and manipulate in Excel.
#2) Your Data from Google Analytics is Now Flexible
This task focused on post Cyber-Monday activity for 2017 versus the same period in 2016. There is a lot of flexibility in the date ranges I can select for comparison. Supermetrics lets me pick as many metrics as I need for my analysis. For my purpose, I looked at sessions, bounce, rate, transactions, revenue and average order value. That’s five metrics which is a lot to start considering what else I had to layer in.
![]() Tip: For you Adobe Analytics folks, the number of pre-populated comparison dates may look small in comparison to Workspace.
Tip: For you Adobe Analytics folks, the number of pre-populated comparison dates may look small in comparison to Workspace.
I gave this part some thought before I went wild, though. Always think about what you truly need to analyze. Remember, too much of a good thing can cripple a data set. While Google Analytics can be a bit confined, Supermetrics pulls in data from multiple sources, lets me use functions and VBA in a snap. Moreover, there is no need to worry about pasting CSV files from Google Analytics, which is a serious time saver.
#3) Customize
Being able to customize the data layout is critical. Device type is important to our client given the surge of mobile traffic many retailers see on Cyber Monday.
This is where the flexibility of Supermetrics again saves the day and my planning pays off. At this juncture, I’m pulling in source/medium and layering in my segments. I’m untethered from some of the limitations of the Google Analytics interface. I further customized my analysis with filters which enabled me to limit my data and include only the data I need for my analysis. Note there is a generous export limit of 1,000,000 rows into Google Sheets for this analysis.
In editing my columns in Supermetrics, I decide to leave that field empty. I do this because each of the five metrics is going to appear in my spreadsheet as one column for this period’s data, and a column for percentage change over last year. That’s ten columns plus one more for row labels.
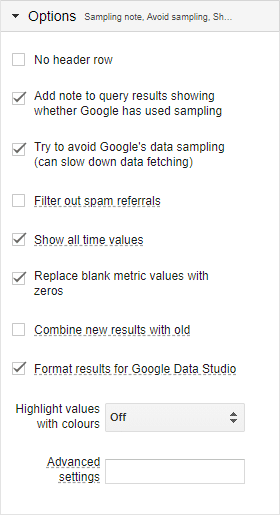
#4) Unsample your Google Analytics Data
Supermetrics offers a great option to unsample your Google Analytics data. As an analyst who has spent a lot of time in Adobe Analytics, the ability to avoid Google Analytics data sampling is a major plus. I recommend setting up a test or two to compare the sampled versus unsampled data to understand the impact on your data. While sampling in Google Analytics isn’t a defacto problem, it’s worth your time as an analyst to learn how it affects your data and how and when it should be avoided.
#5) Edit Data in a Snap
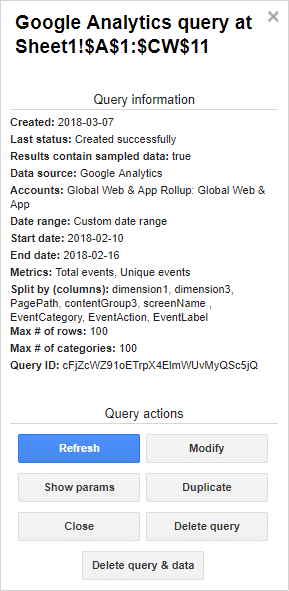
Fortunately, with Supermetrics, the data is a quick edit and a click away! There are two very simple ways to edit your queries.
First, click the modify button, make edits and overwrite what was just run.
The other option is to click on the “Show params” button. Like the unsampling feature, this too is a bit of magic. I can copy and paste multiple values, and within five minutes, I have all my data. All told this data pull took maybe twenty minutes start to finish. The ability to edit on the fly leaves me with a lot time for thoughtful analysis and actionable client results.
The ability to edit on the fly leaves you with a lot of time for thoughtful analysis and actionable insights!
![]() Tip: Note for the Adobe Analytics pros out there, Supermetrics also connects to other data sources, including Adobe Analytics.
Tip: Note for the Adobe Analytics pros out there, Supermetrics also connects to other data sources, including Adobe Analytics.
Supermetrics: Simply Super
My five great things about Supermetrics may sound like a commercial, but this is a genuinely fantastic tool for analysts.
Now that the Olympics has wrapped up, I am reminded of the Olympic creed “Citius, Altius, Fortius,” which in English means, “Swifter, Higher, Stronger.” In analytics we are often looking for swifter ways to do our work. I think our motto is “Faster, Better, Smarter.”
Though this post has centered on Google Analytics, Supermetrics also connects to many other data sources, including Adobe Analytics. I encourage you to give this tool a try with whatever analytics platform you are using. This is just the tip of the iceberg, stay tuned to this blog as we continue to bring you ideas that will elevate your analytics game and please share any that you’re using with us!


If you have questions or you’re ready to discuss how Blast can help you EVOLVE your organization, talk to an Analytics Consultant today.
Call 1 (888) 252-7866 or contact us below.


