Analytics Blog

Sales Forecasting in Adobe Experience Platform Data Science Workspace
If you’ve been researching and comparing capabilities of various customer data platforms, you may already know that Adobe has built an enterprise-level platform for customer experience management — Adobe Experience Platform. I admire Adobe for naming their product around customer experience and not focused on just customer data. The winners of the current customer data platform competition will be those that focus on quickly delivering action on easily discoverable insight.
Within Adobe Experience Platform, Adobe has developed a progressive component enabling predictive analytics in a section named the Data Science Workspace. Adobe Experience Platform is a new platform, and the Data Science Workspace is new functionality. It’s clear Adobe has been heavily investing in technologies that make predictive analytics more accessible to digital marketers.
It’s clear Adobe has been heavily investing in technologies that make predictive analytics more accessible to digital marketers.
The Sales Forecasting Journey Begins
While exploring the features within the Adobe Experience Platform, I had a specific question I wanted to answer for both myself and for my clients: “Just how easy is it to take advantage of the touted data science capabilities integrated into the platform?” My specific goal for this journey was to see if I could build a sales forecasting model. Short-term sales forecasts are useful for assisting with inventory, staffing, and resource management. A time series-based prediction of upcoming revenues would be an ideal metric to add value to a retail business dashboard.
Without a depth of experience in the Adobe Experience Platform Data Science Workspace, I decided to balance reading some of the extensive online documentation Adobe provides with simply navigating the data science section of the platform. The elapsed time from the first click on the “Data Science” tab from within Adobe Experience Platform to the completion of a custom sales forecasting model was surprisingly only a few hours.
To my surprise, one click of an option in the Adobe Experience Platform Launcher — the Python, Retail Sales option — created a nicely documented JupyterLab notebook for me to use, modify, or simply experiment with.
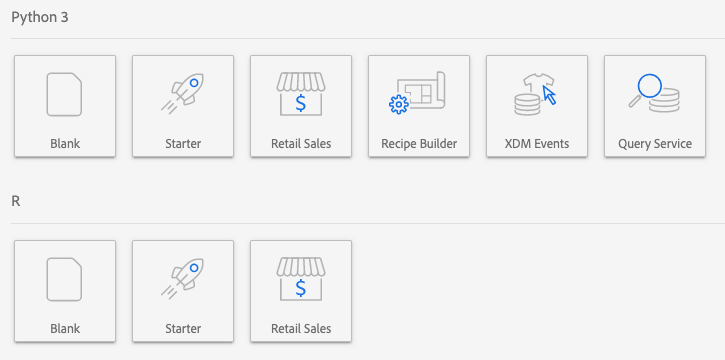
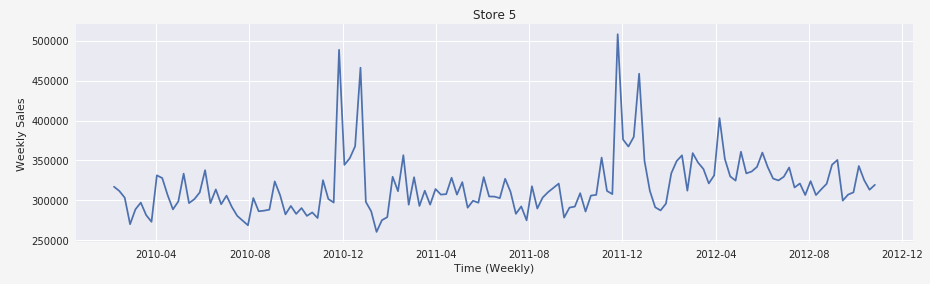
The notebook brought in sample sales data from GitHub. Utilizing a Pandas data frame, the interactive notebook displayed sample rows and field descriptions giving me an immediate sense of the data. The notebook then provided a store by store view of existing sales as well as graphs of correlation for subsets of stores. This was a very nice template for performing some immediate analysis of sales data across multiple stores.
Experimenting with Data Science Workspace
As I ventured into the depths of the notebook I found Adobe also included FIVE variations of sales forecasting methodologies. If you recall, my goal for venturing into the data science portion of the platform was to build a custom sales forecasting model. I had no idea the Launcher had these JupyterLab notebooks already built in:
- Linear Regression
- Decision Tree Regression
- Random Forest Regression
- Gradient Boosting Regression
- K-Neighbor Regression
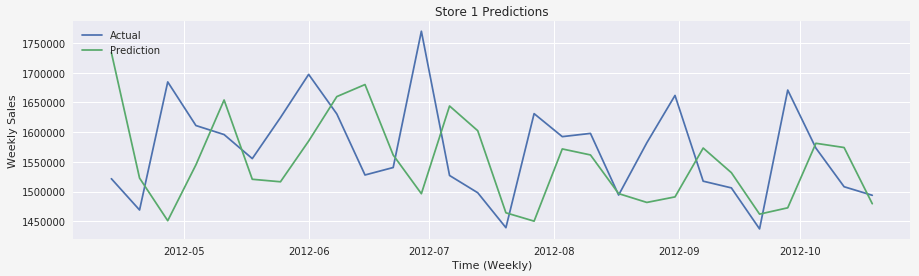
The notebook built all five of these models and then selected the best one based on computing the mean average percentage error (MAPE) for each. The notebook provided a plot of upcoming sales forecasts, comparing to the actual sales for a nice performance visual.
Even though the notebook was available for me with a single click, in the spirit of experimenting and to complete the goal I set out for myself, I had to see if I could build my own model using a blank starter notebook.
How to Build a Custom Sales Forecasting Model
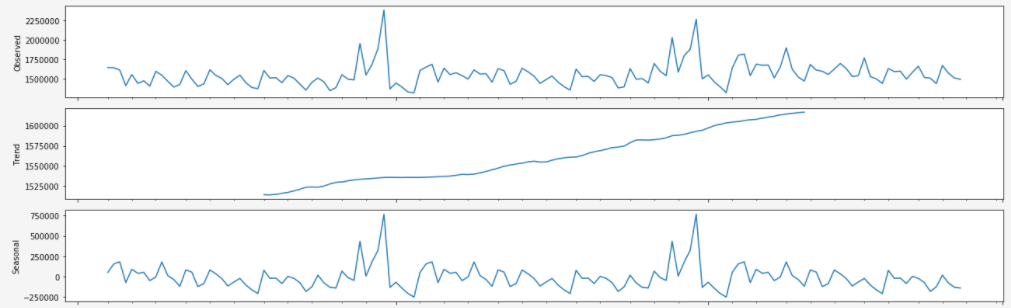
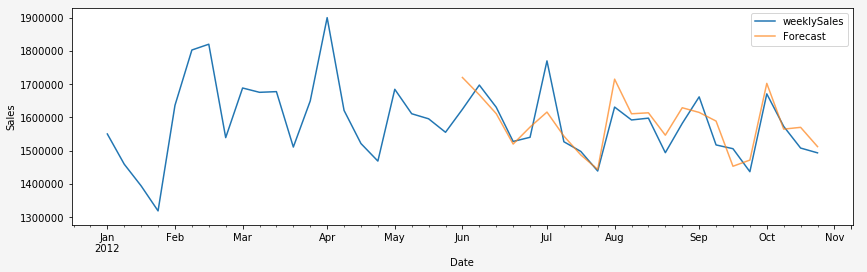
I chose to use the same sales dataset in that it was similar to what I envisioned using for my research — a week-by-week summary of sales records each having a store identifier. As I started my notebook, I again looked at the tables and plots the templated notebook provided me. It occurred to me there was a seasonality component to the data. There are sales spikes in December visible on the plots. To build my custom sales forecasting model, I imported a few more libraries. I added the statsmodels seasonal decompose function into my notebook to confirm the data had both a seasonality to it, as well as an upward trend. I decided I needed a modeling approach that took into account these patterns when predicting future sales.
Dear Adobe, Please Consider Revising your Retail Sales Notebook to Contain a SARIMA Model.
My first choice for time series modeling is the very flexible and robust Facebook Prophet model. Unfortunately, this is not yet available on Adobe Experience Platform. The good news is the statsmodels SARIMAX model library is installed and ready for use.
Within a few iterations of computing and tuning the SARIMAX time series parameters, I was able to build a custom sales forecasting model and apply it to the sample data with a good visual validation of my projected forecasts.
Having a templated notebook ready for immediate use provides a great starting point for an analyst, with or without custom models added. There’s still housekeeping required to handle custom updates to address tailoring these quick-start notebooks for use in a production setting: creating an ongoing recipe for processing live data, ensuring the forecasts and reporting data of interest get prepared and sent out for dashboards to access, etc.
Let’s say I wanted to take my newly calculated forecasts and store them historically, giving me the ability to review how well the models perform over a longer period of time. It wasn’t clear to me if I had to write these forecasts to a new .CSV file for processing later, write custom Python code from within my notebook, or something else entirely. The topic of file housekeeping and custom ETL (extract, transform, load) jobs would be a good addition to the suite of Adobe Experience Platform documentation to close these gaps.
The Power of Predictive Analytics Tools
As I wrapped up working on my custom notebook, I couldn’t help but wonder what else we could do with customer-level data only a few clicks away and the power of a Jupyter notebook with data science libraries baked into the platform ready to evaluate and uncover insight. My thoughts went to predicting customer segmentation based on purchase patterns, churn prediction, lifetime value.
All too often, the data is one level removed from the tools we need to evaluate and explore. Using Adobe Experience Platform (part of the Adobe Experience Cloud), there’s a real opportunity to leap ahead, save time, research, and implement data science, without the need to extract samples off to a remote development environment. The surprise to me was how easy the data science workspace was to use and how well Adobe has democratized machine learning for the enterprise.
Using Adobe Experience Platform, there’s a real opportunity to leap ahead, save time, research, and implement data science, without the need to extract samples off to a remote development environment
Should you be interested in seeing how easy it is to fold machine learning into your Adobe Experience Platform, reach out to Blast Analytics and let us be your guide.


If you have questions or you’re ready to discuss how Blast can help you EVOLVE your organization, talk to an Analytics Consultant today.
Call 1 (888) 252-7866 or contact us below.


