Analytics Blog

How to Measure the Impact of Changes to the Digital Experience
As brands are competing more based on their digital customer experience, stakeholders are very keen to understand the business impact of investing in this area. In doing so, it’s essential that success measurement is properly evaluating the relationship between the change in the experience and the impact on business goals. Ideally, this relationship would be investigated in a formal test or experiment. However, testing isn’t always feasible. Below, we outline the next best approach known as regression discontinuity design, or simply regression discontinuity, to quantify the effect of changes that have been made to your digital experience.
The reason a formal experiment is so crucial to defining relationships is that experiments allow us to differentiate between causation and correlation. Causation is when “event A” directly causes “event B.” Correlation is less clear, and simply shows there’ a relationship between “event A” and “event B.” This could be due to different situations such as:
- “Event B” actually causes “event A”
- “Event C” causes both “events A” and “event B,” and we saw the resulting changes
- “Event A” causes “event C,” which in turn causes “event B”
It’s commonly said that “correlation does not imply causation” and it’s exactly for these kinds of situations.
The Only True Way to Measure Causation – Experimental Designs
As highlighted earlier, establishing a culture of experimentation is an effective way to measure improvements to the digital experience. In fact, a formal experimental design is required if a true causal relationship is the goal. Experiments allow us to create a focused test that’ll investigate the relationship of a specific action and a desired outcome. More importantly, it limits the impact of external factors that aren’t part of the relationship being investigated. It’s this part of the experimental process that allows us to determine whether the action causes the reaction or is simply correlated to it.
Establishing a culture of experimentation is an effective way to measure improvements to the digital experience. Click & Tweet!
However, running a formal experiment may not be possible in all situations. In which case, a quasi-experiment or observational experiment is the next best approach. These may not allow us to conclude 100% causality, but we’ll be able to quantify results with statistical significance and, ultimately, increase confidence in the relationship between actions and outcomes. One such quasi-experiment, called regression discontinuity design, has proven effective when formal testing isn’t an option.
Regression Discontinuity Design is the Next-Best Approach
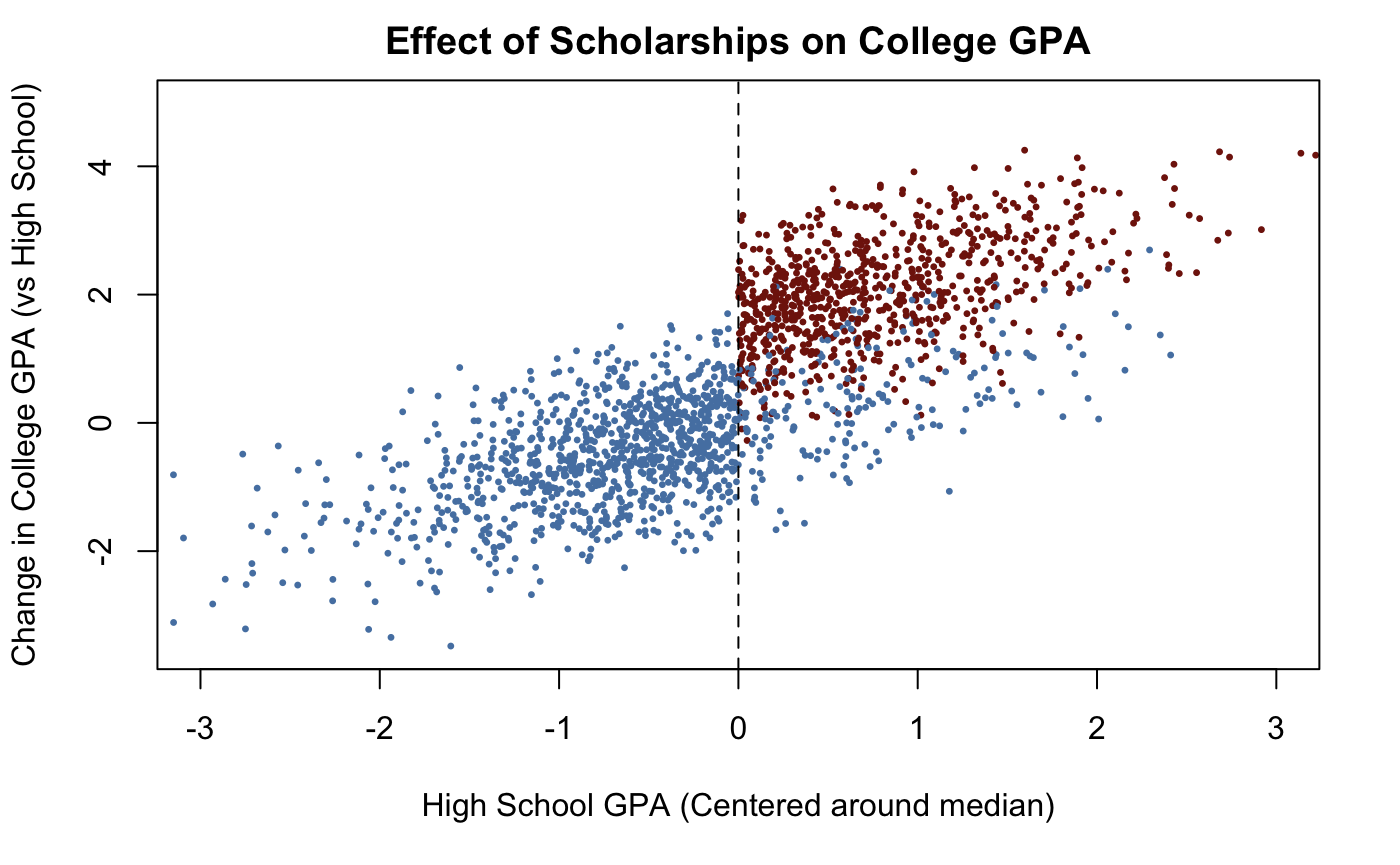
Regression discontinuity design, also known as RDD or regression discontinuity, is a method based on the standard regression formula. It’s known as regression “discontinuity” design because the data is split at some threshold, indicating a “treatment period.” The original use case for RDD was a study done around merit-based scholarships and the resulting students’ performance. Since merit-based scholarships are more likely to be awarded to students with high grades, those same students are naturally more likely to perform better than other students. However, a student that has high grades and also received a scholarship will behave at an even higher level, even though a student with a 3.5 GPA (grade point average) and a scholarship is still similar to a student with a 3.4 GPA and no scholarship. Thus, there needed to be a way to measure not only the effect of higher GPA on performance, but also the effect of receiving a scholarship. RD allowed the cutoff GPA to be the starting point of the “scholarship treatment” and find the resulting treatment effect. The data below is simulated but resembles how the scholarship data could behave.

RDD has been used in plenty of scientific situations, including air quality, traffic tracking, energy use, and others. However, due to its versatility, we see this approach working for various user experience use cases. One example is measuring the revenue increase that may come from site-wide performance improvements or search engine optimization (SEO) changes. Another use case could be for competitor analysis, where a competitor launches a new product or campaign, and you want to know the impact that the increased competition had on your own key performance indicators.
Leveraging Regression Discontinuity Design – Business Use Case
Blast Analytics has applied RDD as part of its success measurement for clients, where experimentation isn’t possible. For example, we analyzed how our page speed recommendations for a client ultimately improved average page load times, as well as the average revenue per user. These changes were done for the purpose of helping the client’s SEO performance. Studies have shown that improving site speed has a positive impact on revenue metrics, as users are more likely to engage with a faster digital experience. However, this might not be guaranteed in all cases, so we were interested in understanding the specific impact for our client.
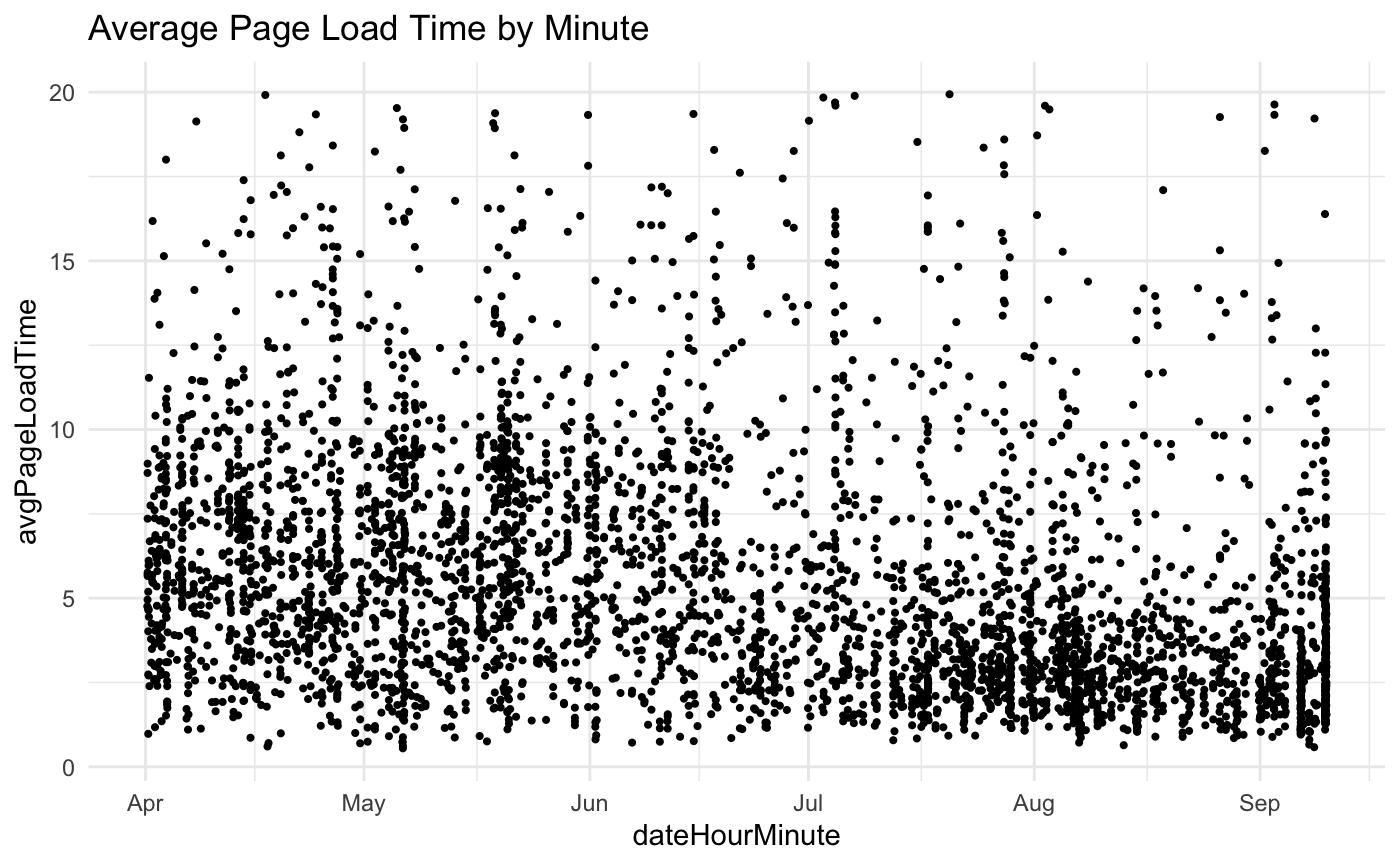
Leveraging Google Analytics, it was possible to gather data by the date, hour, and minute as the dimension. This allowed us to get enough data points before and after the changes took place to measure the effect the site changes had. We then used the metric “Avg. Page Load Time (sec)” to make sure the changes that were made to the site took place and had the effect that we intended. This resulted in data similar to Figure 2 below (Average Page Load Time by Minute). Note that this is real data that has had random noise added to it to not show confidential information.

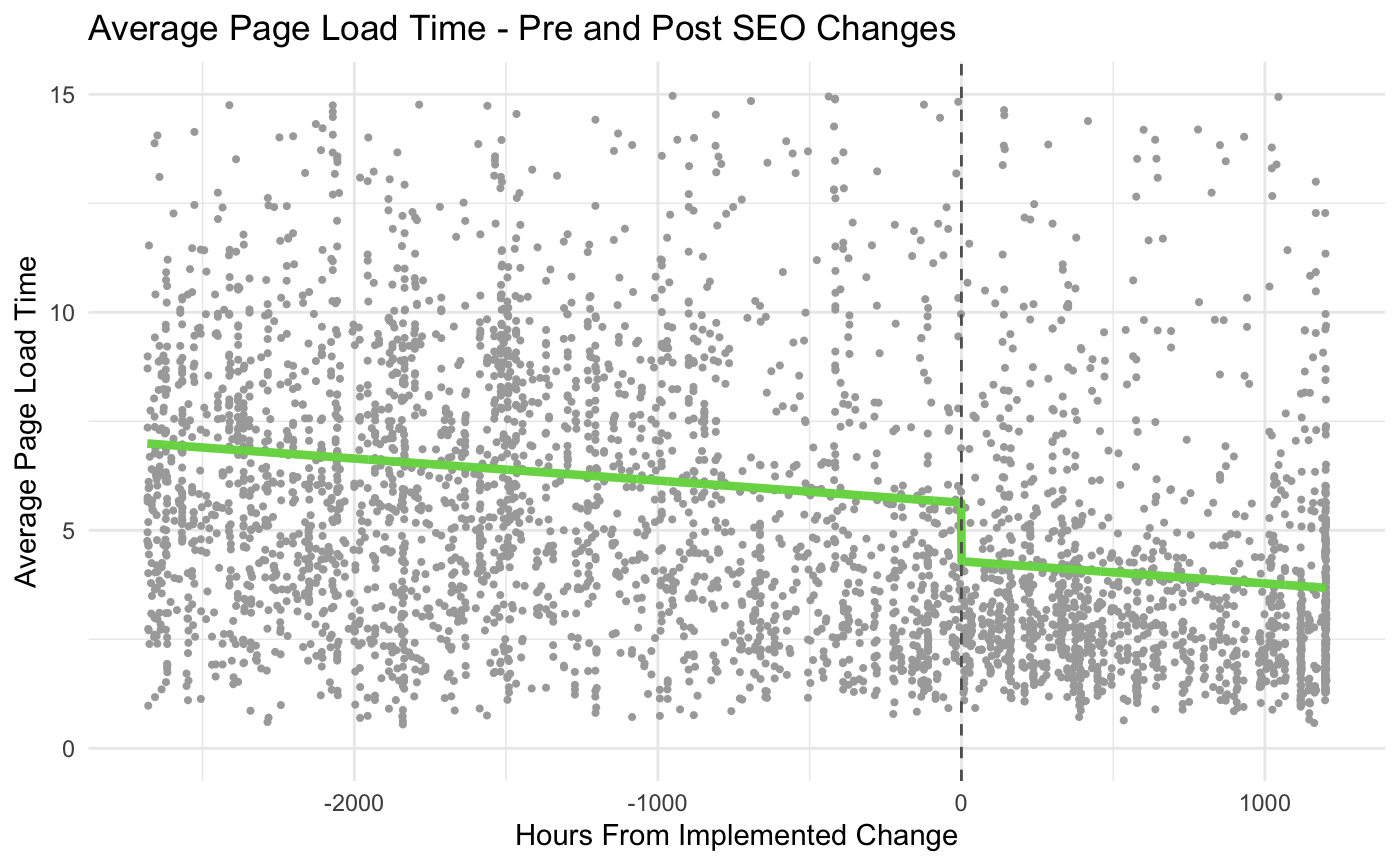
Using the RD model, we were able to show the trend of the data pre- and post-site changes, as well as the magnitude of the shift. The end model looked similar to Figure 3 below (Average Page Load Time – Pre and Post SEO Changes).

We could see that there was a downward trend in page load times before the changes were implemented, likely from efforts of the development team to improve the site. However, at the change point, we can see that there was a sharp drop in page load times. The model tells us that this was about a 0.98-second decrease in load times, a statistically significant drop. While we expected that there’d be better page load times, a concrete value helped quantify that improvement for the business.
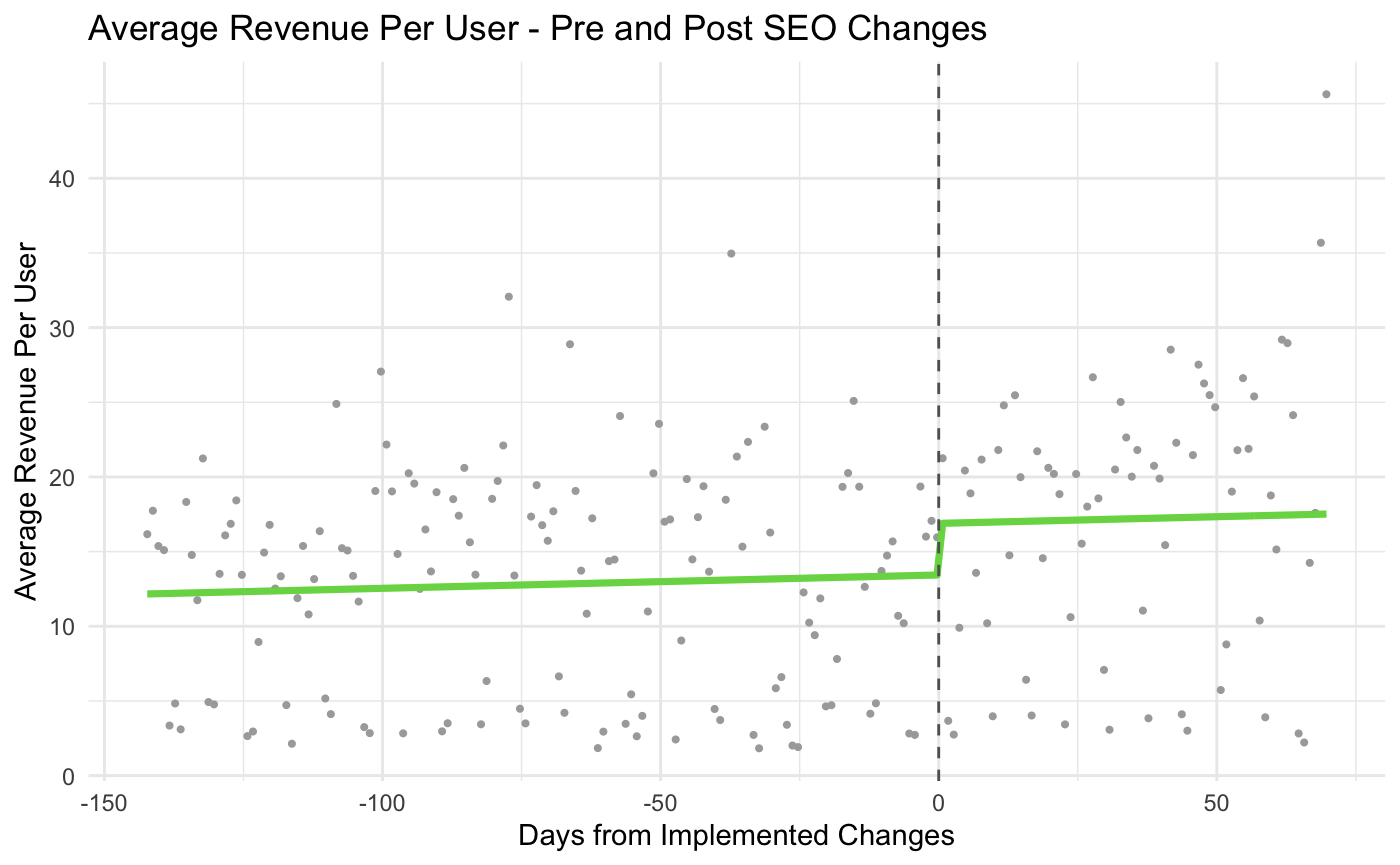
Knowing that the site speed has improved is one outcome, but that change was to be expected. The true point of interest was the impact that these changes had on Average Revenue Per User (Figure 4 below). Once again, we leveraged data from Google Analytics but this time using the “Revenue per User” metric along with random noise added to keep the data confidential.

The RDD model estimated that after the SEO changes were made, there was a $3.17 increase in average revenue per user, with over 90% statistical significance. Although we weren’t able to establish 100% causality between the page speed improvements and the increase in revenue per user because this wasn’t part of a formal test, we were able to leverage the RDD model to add more rigor around our data analysis. Ultimately, this increased reliability in our findings, specifically that the page speed improvements had a positive impact on revenue per user.
This was a high-level example of how the regression discontinuity model can be used to measure the impact of changes to the digital experience. For a deeper dive into this approach, including code and data transformations necessary to run this model, download our white paper on Regression Discontinuity Design in Digital Experience.
Perfection Isn’t Always Possible
The best method to measure business impact is always creating a formal test with controlled variables and ensuring that all changes are intentional and measured. This is the only way to know that the changes being made have a true causal relationship with the desired outcomes. However, when experimentation isn’t possible, regression discontinuity is a next-best approach. Ultimately, adding more rigor around success measurement is important to ensure businesses aren’t making key decisions based on perceived impacts or impacts that lack causation.
The best method to measure business impact is always creating a formal test with controlled variables and ensuring that all changes are intentional and measured. Click & Tweet!
Is your organization interested in taking success measurement to another level? Organizations look to Blast as a strategic partner when it comes to their digital customer experience, including optimizing acquisition efforts, establishing a culture of experimentation, and applying statistical rigor when measuring business impact.


