Analytics Blog
Mining Customer Journey Insights from Adobe Analytics
Stop asking general questions. Become more proactive with customer journey analysis reports to glean insights you can take action on, today!
All companies are different. They have different objectives, purchase cycles, marketing strategies and so on. Put all the pieces together and you’ve built a customer journey that is unique to your business.
Trying to make sense of all the data might leave you with analysis paralysis caused by having too many analytics reports, or wondering how to best slice your simple “visits” report to yield valuable insights. Using the flexibility of Adobe Analysis Workspace, segmentation, and calculated metrics, we can cure these issues with customer journey reporting.
A Customer Journey Can be an Epic Adventure
One thing that’s true for all companies is the fact that as each person comes to your website, you have one (or many) objectives that you’d like them to meet. These objectives, large and small, each serve their own purpose in progressing the users along the customer journey.
Objectives can be as simple as creating an account on the site, or as complicated as visiting the site from a specific campaign to consume a particular piece of content. Whatever that objective may be, it has its own place along the customer journey.
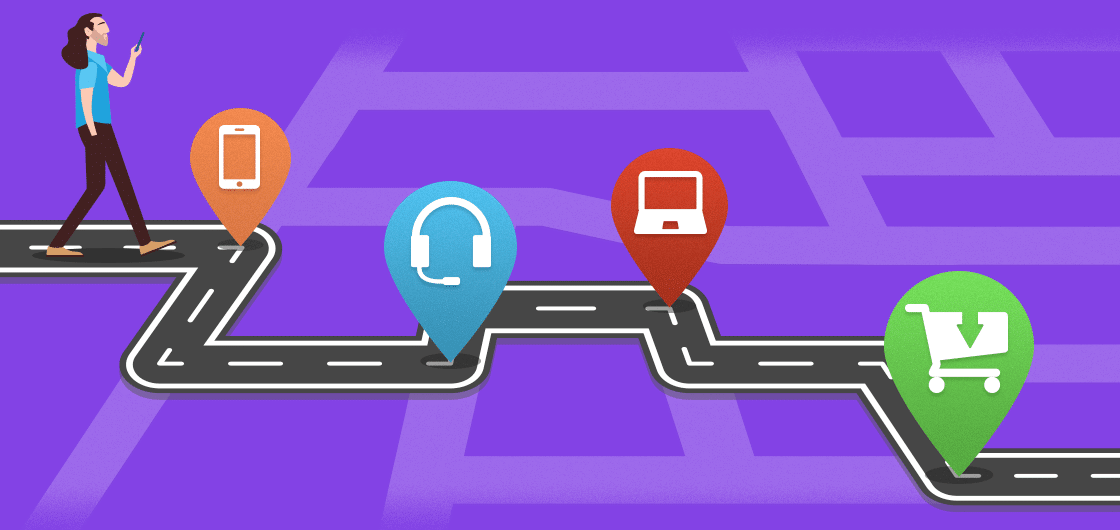
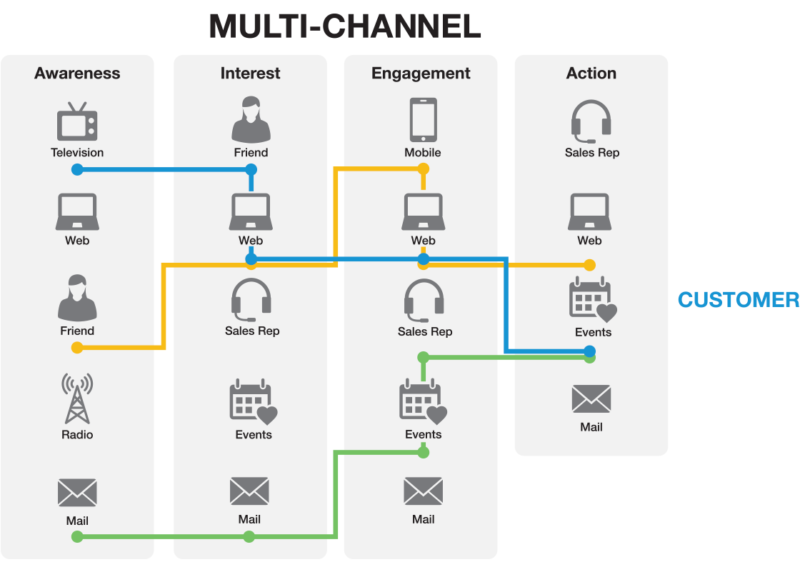
Another thing that’s clear in this multi-screen world is that users do not move in a perfectly linear fashion.
Their journey may span multiple devices, or even cross hard-to-track, non-digital sources such as TV, radio, referrals from a friend, and etc.
Just like no two customer journeys are alike, not all visits to a site or sessions on an app are created equal.
As a consumer, you probably visit dozens of websites every day. Each time you start a new session on a site, you have a specific reason for that visit.
Let’s look at a pretty basic group of site visits that (if you’re like me) you might string together over the course of a few days:
- You might be on Twitter and see a link to an article about baseball that sounds interesting.
- You click on the link and land on the site with the intention of reading that article.
- The article mentions The Mariners, so you decide to go to their website to find out when the next home game is.
- You see it’s scheduled for the next weekend and start thinking about the possibility of going to the game.
- Eventually, you decide to commit and go to a ticket aggregator to browse for tickets.
- You solidify plans with some friends and head back to the aggregator with the intention of purchasing some tickets.
- Later, through a social media campaign, you realize the team is going to be wearing throwback jerseys that weekend and you want to participate. You go back to the team website with the intention of buying a new throwback t-shirt.
Over the span of a few days, you met the following objectives:
- Consumed content on a blog.
- Downloaded a schedule on a team website.
- Researched prices on a ticket aggregator site.
- Purchased tickets on the same site, but during a separate visit.
- Purchased merchandise on the team website during a separate visit.
Every visit to each of these sites was a different stage in a customer journey unique to that site. Sometimes you even visited the same site twice, each time with a different purpose, as part of a different stage along the customer journey.
Trying to sort through this mess of data is difficult and can be frustrating. You might be looking at a ton of dashboards and reports and asking yourself, “How are all of these things connected?” Or you might be at the other end of the spectrum, looking at an analytics report of overall visits to your site and wondering what caused the most recent dip or spike in traffic.
How to Create a Customer Journey Report with Adobe Analytics
Luckily, there’s a way to get valuable insights out of a simple customer journey report.
Step 1: Create a Customer Journey Map
The first thing you should do is take a 30,000 ft look at your website (or app) and get a good sense of how it fits into your business model as a whole. What you’ll want to do is map out the high-level stages of your customer journey.
Sometimes it helps to start with the end in mind: what is the most important KPI that can be performed on your site?
For an ecommerce site, it could be making a purchase. For a lead generation site, it could be submitting a form. For a content site, it could be creating an account or purchasing a subscription.
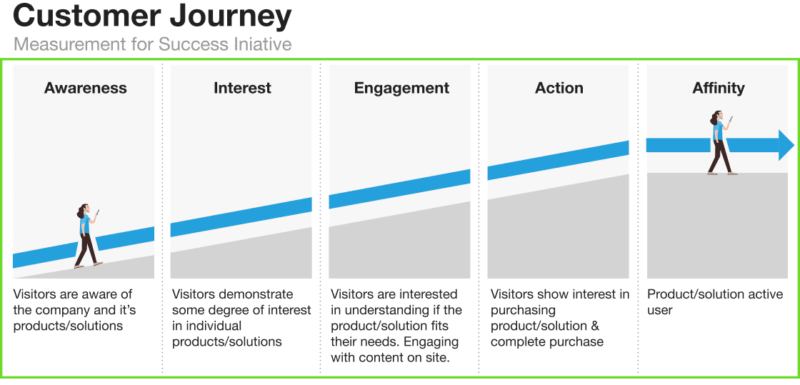
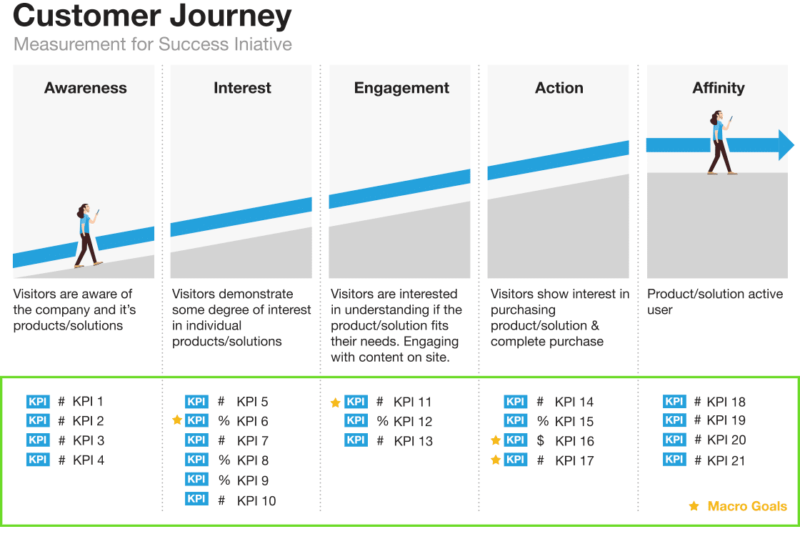
Figure out what that main purpose of your site is and work backwards to the very beginning of the customer journey. There’s no limit to the number of stages you can have. Some companies may have a very short and simple user journey map, such as the one below:
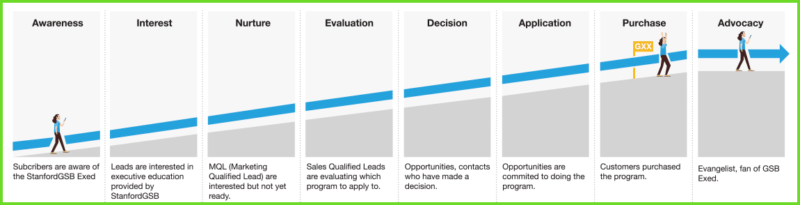
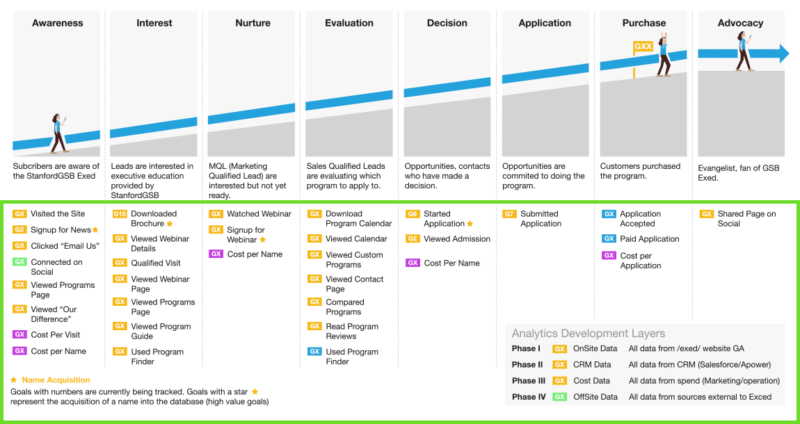
Or you might have one that involves a number of stages over a long period of time:
If you’re stuck, try using these basic steps as a customer journey map template:
- Awareness: This is the very top of your sales funnel. These are the people who are either just hearing about your business for the first time, or have a passing knowledge of your site/brand.
- Interest: These visits represent more than just a surface level knowledge of the brand. They may not have much more engagement than the awareness visits, but the way they come to your site can be a good indicator of this stage.
- Engagement: This stage represents some level of engagement with your site. This stage will have a number of micro-goals that are hopefully going to lead your visitors to the larger macro-goal in the next stage.
- Action: This is your main conversion stage. It doesn’t have to be limited to just the conversion event. It could involve supporting KPIs as well.
- Affinity: At this point, the visitor has already performed the main goal of the site and they are returning to re-purchase or convert again. They might also exhibit other behaviors to advocate for your brand (i.e. social sharing, leaving reviews, etc).
Again, this is just intended to be a launching point. Your customer journey map might look very different from this.
Step 2: Identify KPIs
Here’s how it might look with a larger number of stages over time:
Next we’re going to identify the individual KPIs that occupy each stage within this customer journey. Get as specific as you want and name as many as you want. It works best if you have between 3 and 5 KPIs within each stage. But again, you can have more than that.
It’s important to identify some relevant custom dimensions that can be used to slice up the KPIs for deeper customer journey analysis.
For example, if “account creation” is one of your KPIs, you might want an account-type dimension to slice that up. Or, if you have organic search non-homepage entries, you may want to add in the entry page to see which page it is that is getting the traffic.
There is no limit here to what dimensions you can identify. What’s important is that you be intentional about it (i.e. don’t just say “all dimensions”). Try to think about each KPI individually and list out dimensions that relate to that KPI.
Step 3: Create Segments
- Assuming everything in stage 2 is tagged, open up Adobe Analytics and start creating segments. At the end of this step you should have one segment for each stage in the customer journey analysis.
- Make sure they are visit-scoped, and start adding a series of containers. In the end, you should have one container for each KPI in that customer journey analysis stage.
- String together these containers with OR statements. This way, if over the course of a visit any of the KPIs are performed, their visit will be “classified” as a visit that falls into that customer journey analysis stage.
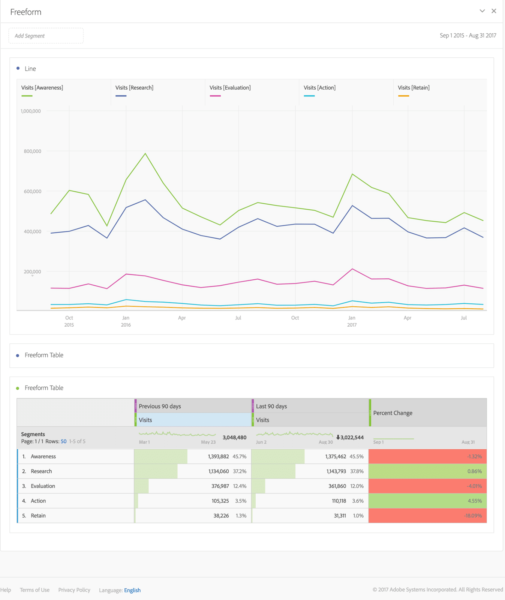
Step 4: Build an Overview Dashboard
Take all of your newly created segments and trend them over time to get a high-level view of how each customer journey stage is trending. This is meant to be an executive dashboard that doesn’t provide in-depth illumination of each individual KPI. Instead, it gives you an overarching view of what level your site visitors are at.
Step 5: Generate a Segment-Specific Dashboard
Now that you have an executive-level dashboard, it’s time to zoom in on a single customer journey stage. The idea is, if someone is looking at the customer journey overview dashboard and sees a drop or spike, they can now dig deeper and see exactly which KPI is the root cause.
For example, you may notice that your “awareness” visits have been dropping. You dig a bit deeper into your awareness dashboard and realize that a large amount of that drop has come from non-branded paid search visits. You’re then able to determine exactly which campaigns and landing pages have been underperforming.
Begin taking ACTION
This provides you the impetus to begin taking action to fix those campaigns.
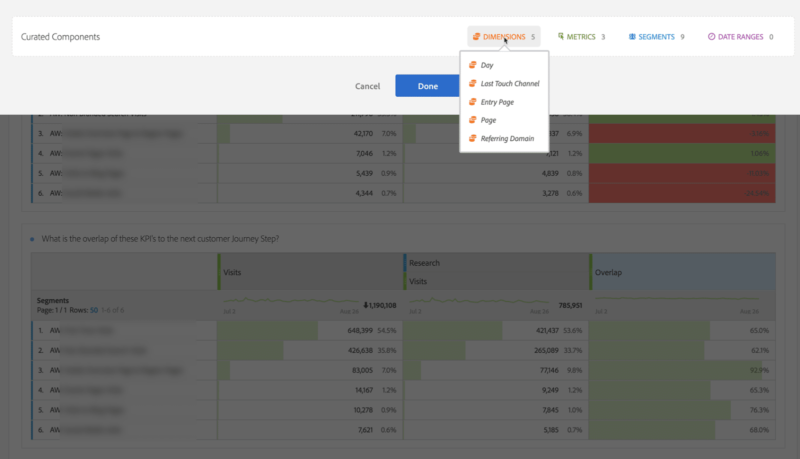
Step 6: Utilize Curated Workspaces
Finally, the analytically mature can utilize the Curated Components feature in Adobe Analysis Workspace to create a controlled environment for ad hoc analysis.
This is where you’re going to make use of the list of dimensions you put together in Step 2. Load up this workspace with all of the metrics, dimensions, segments, and date ranges necessary for analysis.
The specific list of variables that you’ve curated will help you avoid becoming overwhelmed, or using the wrong ones in your reports.
These curated workspaces are great because they’re a step away from the traditionally rigid format of dashboards. This takes full advantage of the freedom Adobe Analysis Workspace offers and allows you to answer more complicated questions on the fly that can’t simply be shown in a single analytics report.
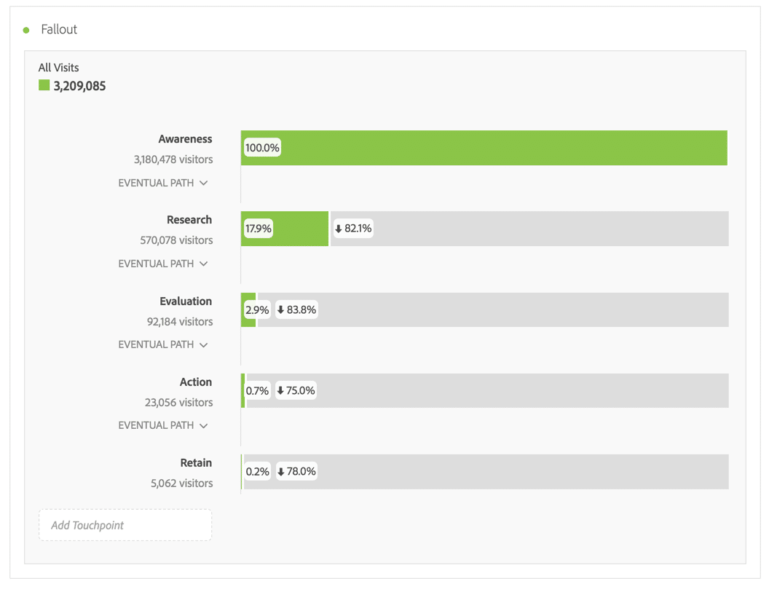
Bonus: Use the Fallout Report
I’ve been a huge fan of the new Adobe Analytics Fallout reports from day 1. You can use them to show the fallout rate of your customer journey steps.
Even better, you can make these reports visitor-based so they can span multiple visits to the site. This will allow you to see where it is along your customer journey that you’re having the most or least success in progressing visitors through the funnel.
Becoming Proactive with Adobe Analytics Data
…stop asking general questions
Following these steps will allow you to stop asking general questions such as “how is our website doing?” or “how did our last campaign perform?”
It will inspire more strategic thinking and get your team out of the habit of simply doing descriptive analysis and into prescriptive analysis.
You can now look at data and be proactive rather than reactive. It will guide your eyes and give you more meaningful ideas as to where your time and money is better spent.
And finally, it will allow you to do more of what works and less of what doesn’t.
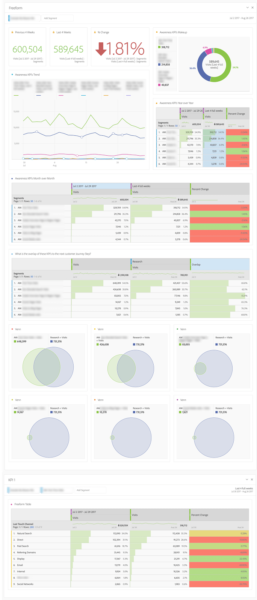
In the end, you’ll go from vague and boring reports like these:
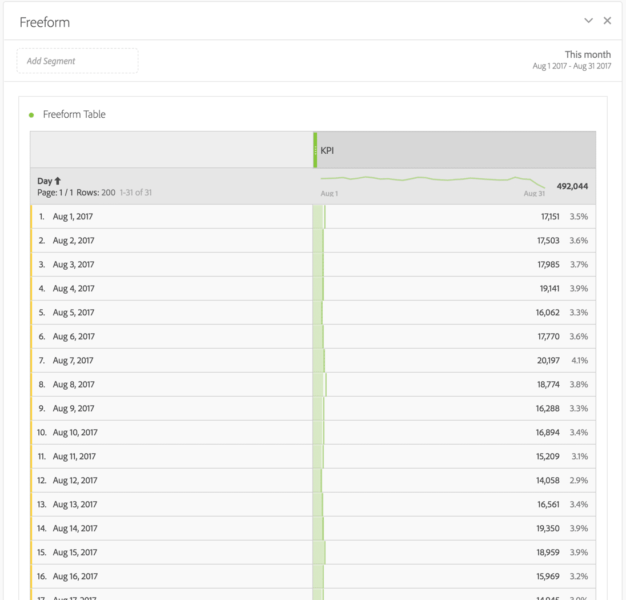
To a more interactive set of customer journey dashboards and workspaces like these:
Good luck with your customer journey analytics reporting. Please comment below with any questions about your customer journey analysis.


If you have questions or you’re ready to discuss how Blast can help you EVOLVE your organization, talk to an Analytics Consultant today.
Call 1 (888) 252-7866 or contact us below.


