Analytics Blog

Why Data Storytelling is an Essential Data Science Skill
As data becomes increasingly ubiquitous, companies are desperately searching for talent with data science skills. In LinkedIn’s annual top 10 hard skills, data analysis skills were featured twice, with analytical reasoning (#3) and business analysis (#6). Interestingly, while company recruiting efforts have centered on these data analysis skills, less emphasis is being placed on the “last mile of analytics” skills that help convert business insights into actions. Many of the heavily-recruited individuals with advanced degrees in economics, mathematics, or statistics struggle with communicating their insights to others effectively — essentially, they haven’t been trained in data storytelling.
Your data may hold tremendous amounts of potential value, but not an ounce of value can be created unless insights are uncovered and translated into actions or business outcomes. During a 2008 interview, Google’s Chief Economist Dr. Hal Varian stated, “The ability to take data — to be able to understand it, to process it, to extract value from it, to visualize it, to communicate it — that’s going to be a hugely important skill in the next decades.” Fast forward to today and many businesses would still agree with Varian’s astute assessment.
The Data Science Skill Everyone Needs

The need for trained data storytellers is only going to continue increasing. With the shift towards more self-service capabilities in analytics and business intelligence, the pool of people generating insights is expanding beyond just analysts and data scientists. The new breed of tools make it easier for people across business functions to access and explore the data on their own. As a result, we’re seeing an unprecedented number of insights being generated within companies than ever before.
However, unless we can improve the communication of these insights, we will continue to see a poor insight-to-value conversion rate. If an insight isn’t understood and isn’t compelling, no one will act on it and no change will occur.
Storytelling is More Than Just Data Visualization
Data visualization expert Stephen Few said, “Numbers have an important story to tell. They rely on you to give them a clear and convincing voice.” Any insight worth sharing is probably best shared as a data story. The phrase “data storytelling” has been associated with many things — data visualizations, infographics, dashboards, data presentations, and so on. Too often data storytelling is interpreted as just visualizing data effectively, however, it’s much more than just creating visually-appealing data charts.
Data storytelling is a structured approach for communicating data insights, and it involves a combination of three key elements: data, visuals, and narrative.
Data storytelling is a structured approach for communicating data insights.
Narrative Coupled with Data
It’s important to understand how these different elements combine and work together in data storytelling. When narrative is coupled with data, it helps to explain to your audience what’s happening in the data and why a particular insight is important. Ample context and commentary are often needed to fully appreciate an insight.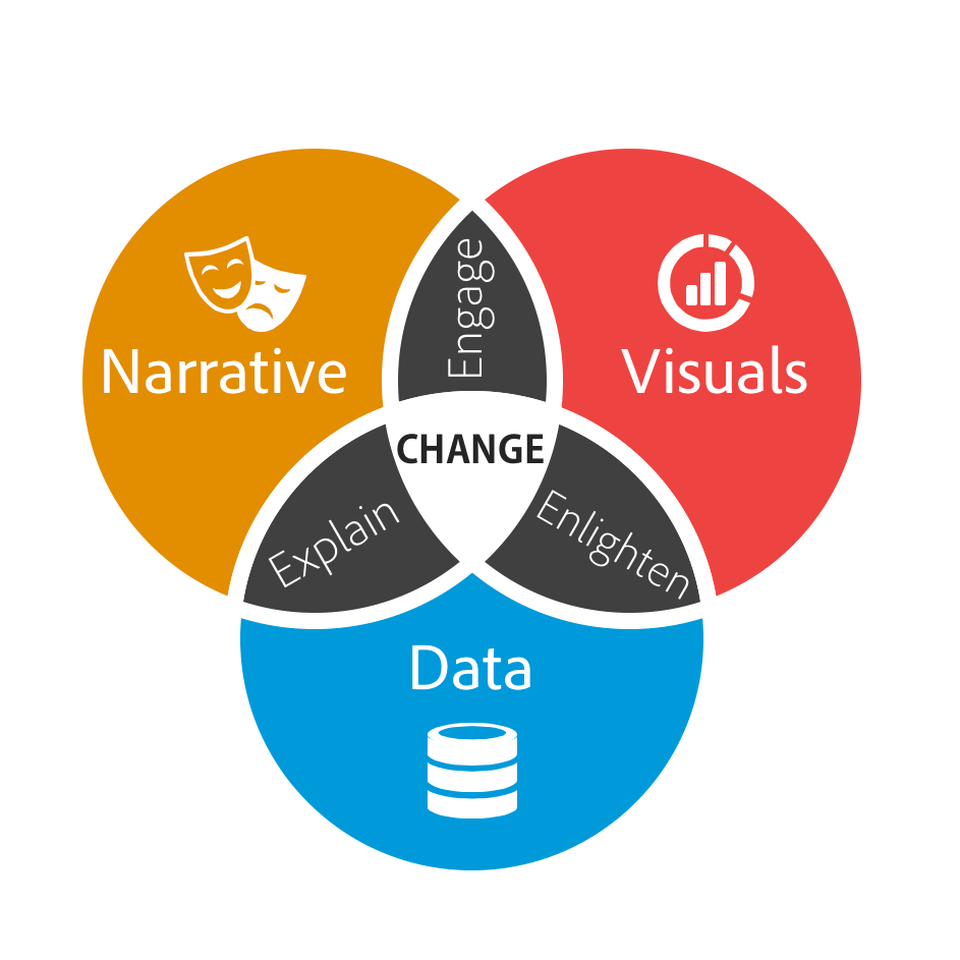
Visuals Applied to Data
When visuals are applied to data, they can enlighten the audience to insights that they wouldn’t see without charts or graphs. Many interesting patterns and outliers in the data would remain hidden in the rows and columns of data tables without the help of data visualizations.
Narrative and Visuals Merge
Finally, when narrative and visuals are merged together, they can engage or even entertain an audience. It’s no surprise we collectively spend millions of hours consuming movies and TV shows to immerse ourselves in different lives, worlds, and adventures. When you combine the right visuals and narrative with the right data, not only have you mastered an essential data science skill, you’ve also created a data story that can influence and drive change.
When you combine the right visuals and narrative with the right data, you have a data story that can influence and drive change.
Why Storytelling is Essential to Business
For thousands of years, storytelling has been an integral part of our humanity. Even in our digital age, stories continue to appeal to us just as much as they did to our ancient ancestors. Stories play a vibrant role in our daily lives — from the entertainment we consume to the experiences we share with others to what we conjure up in our dreams.
Modern-day storytelling is often associated with the popular TED conference series and its slogan of “Ideas Worth Spreading.” Analysis of the most popular 500 TED Talk presentations found that stories made up at least 65% of their content. Throughout time, storytelling has proven to be a powerful delivery mechanism for sharing insights and ideas in a way that is memorable, persuasive, and engaging.
Storytelling has proven to be a powerful delivery mechanism for sharing insights and ideas in a way that is memorable, persuasive, and engaging.
For some people, crafting a story around the data may seem like an unnecessary, time-consuming effort. They may feel the insights or facts should be sufficient to stand on their own as long as they’re reported in a clear manner. They may believe the revealed insights alone should influence the right decisions and drive their audience to act. Unfortunately, this point of view is based on the flawed assumption that business decisions are based solely on logic and reason.
In fact, neuroscientists have confirmed decisions are often based on emotion, not logic. USC professor Antonio Damasio found patients, who had brain damage in an area that helped to process emotions (prefrontal cortex), struggled to make basic decisions when choosing between alternatives. Deciding on where to eat or when to schedule an appointment turned into lengthy cost-benefit debates for these individuals. Interestingly, these patients’ decision-making skills were significantly impaired by the lack of emotional judgment. Emotion actually plays an essential role in helping our brains to navigate the alternatives and arrive at a timely decision.
Building a Data Bridge

When you package up your insights as a data story, you build a bridge for your data to the influential, emotional side of the brain. When neuroscientists observed the effects detailed information had on an audience, brain scans revealed it only activated two areas of the brain associated with language processing: Broca’s area and Wernicke’s area. However, when someone is absorbed in a story, they discovered it stimulated more areas of the brain. People hear statistics, but they feel stories. This subtle but important difference, pays dividends for data storytellers in a few key ways:
People hear statistics, but they feel stories.
Memorability
A study by Stanford professor Chip Heath (Made to Stick author) found 63% could remember stories, but only 5% could remember a single statistic. While 2.5 statistics were used on average in the exercise and only 10% of the participants that incorporated a story, the stories are what caught people’s attention.
Persuasiveness
In another study, researchers tested two variations of a brochure for the Save the Children charity organization. The story-based version outperformed the infographic version by $2.38 to $1.14 in terms of per participant donations. Various statistics on the plight of African children were far less persuasive than the story of Rokia, a seven-year-old from Mali, Africa.
Engagement
Researchers also discovered people enter into a trance-like state, where they drop their intellectual guard and are less critical and skeptical. Rather than nitpicking over the details, the audience wants to see where the story leads them. As mathematician John Allen Paulos observed, “In listening to stories we tend to suspend disbelief in order to be entertained, whereas in evaluating statistics we generally have an opposite inclination to suspend belief in order not to be beguiled.”
Where Data Science Skills Converge
In a previous article, I shared an account of Ignaz Semmelweis, a mid-nineteenth century obstetrician, who discovered hand washing could save countless lives but failed to communicate his findings effectively to a skeptical medical community. His data was ignored, his life-saving ideas were rejected, and he was sadly discredited by his colleagues.
Many bold, incredible insights will suffer a similar fate if they are not successfully molded into data stories. Uncovering key insights is one data science skill and communicating them is another — both are equally critical to deriving value from the data your business is now amassing. Data storytelling represents an exciting, new field of expertise where art and science truly converge. My hope is more data storytellers — from across an organization — will emerge to ensure the survival and adoption of more transformative insights.
This article was originally published on Forbes.com.


If you have questions or you’re ready to discuss how Blast can help you EVOLVE your organization, talk to an Analytics Consultant today.
Call 1 (888) 252-7866 or contact us below.


