Analytics Blog

Repair Your Data in Google Analytics 360 with Query Time Processing
Since its inception, Google Analytics as a tool for capturing visitor interactions on commercial websites has been a one-directional venture. A web analyst sends data in, and from that point forward it is locked down with no ability to make updates. The difficulty this poses is apparent when issues with tracking code surface and the data you hoped for is not what you have.
This was the case recently where Blast had an opportunity for a quick win by working with one of our Google Analytics 360 clients using the Query Time Custom Data Import feature. This is a fairly long name for a feature buried deep within Google Analytics 360, but what it offers is pretty groundbreaking for people like me who are constantly looking at ways to add value for our clients by enriching their data.
“…what it offers is groundbreaking for people like me who are constantly looking at ways to add value for our clients by enriching their data.”
That’s Not The Data I Asked For
Late last year, a client approached Blast with an interesting request to fix their custom data.
To set the stage, the client was using Google Analytics in a closed environment designed for authenticated members only, and thereby some of the data captured was atypical of public sites. As many web analysts do at the end of a year, they had been reviewing year over year data between 2016 and 2017 focusing on a field called Age Group, populated as a custom dimension from their internal membership system. A sample of the data can be seen on the following dashboard screenshot:
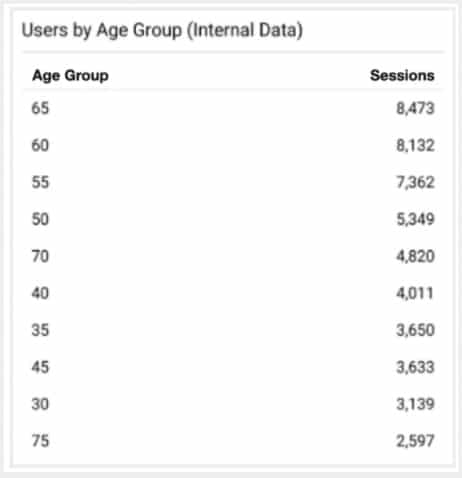
To match with other internal reports, every member’s age was grouped into a clean age group bucket for reporting purposes.
Fast forward to the end of 2017 and the client discovered they at some point during the year they accidentally started capturing the custom dimension Age, instead of the coarsely classed Age Group. This unanticipated change in the data being captured made the year over year results difficult to review. This is when they contacted us with the following request:
Client: “We want the ability to compare to historical data in our Google Analytics reports and we can’t…can you fix it?”
Blast: “YES WE CAN!”
We can help address their reporting needs by creating a NEW custom dimension with data that matches Age Range used historically. All we need is a process within Google Analytics 360 to take what we have — an exact Age— and calculate the new Age Range dimension using it. We can use the Query Time Custom Data Import feature. Keep in mind, this is a feature available only to Google Analytics 360 (not standard) clients.
How to Map Out The Desired Transformation
Step 1: Ensure we would properly categorize age into an appropriate age group based on the historic definition.
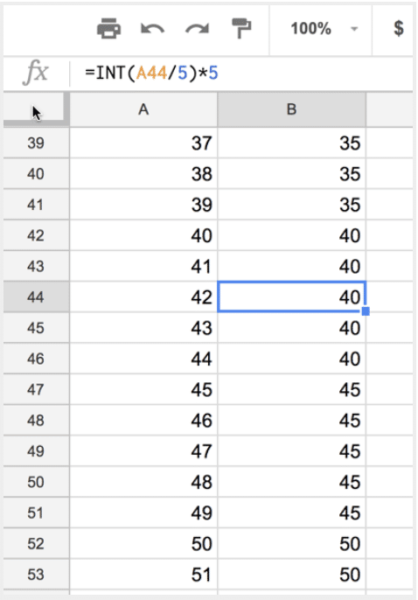
Step 2: Create a Google Sheet using a formula to calculate the age group from age. In selecting to use Google Sheets we could then share a link, jointly QA the test data, and get buy-in for the next step.
Step 3: Use this data to import a new Google Analytics table.
Configure Google Analytics 360 Settings
Jumping over to the Google Analytics 360 property settings, we need to add the new custom dimension for Age Range. In this case we match the scope of the existing custom dimension Age.
![]() Tip: Note the actual number of the dimensions, e.g. dimension 4 and dimension 7, or whatever the two are. This is critical now because we need to add these two values as Google Analytics key pairs as the first row in our sheet as noted below. What this row does is to serve as the definition to Google during the upload process. The upload process creates the schema as a result.
Tip: Note the actual number of the dimensions, e.g. dimension 4 and dimension 7, or whatever the two are. This is critical now because we need to add these two values as Google Analytics key pairs as the first row in our sheet as noted below. What this row does is to serve as the definition to Google during the upload process. The upload process creates the schema as a result.
Since the Google Analytics import process asks for a CSV file, export the Google sheet file locally. You’ll need that in a minute.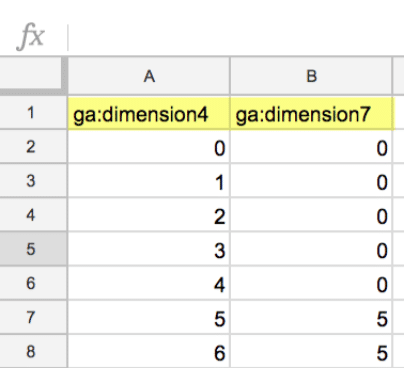
Now we need to go into the menu item called “Data Import.” When we click to create a new table we are presented with a few options. For our solution we choose the Custom Data option.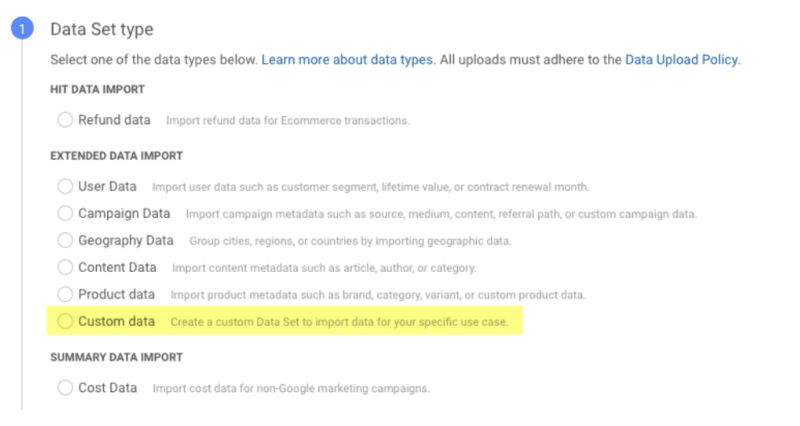
Next step is to select the import behavior, and here’s where we select the Query time option. Your system console may note this feature is in beta which according to Google was available to all Google Analytics 360 clients at the end of 2017. 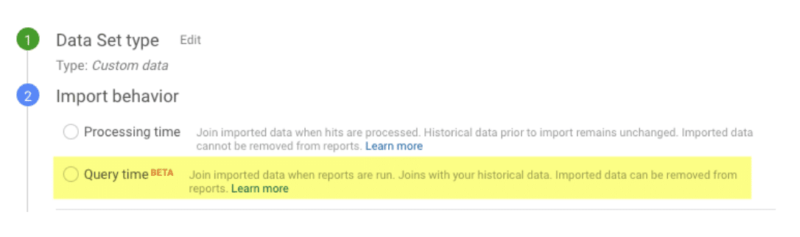
The last step prior to the import process is to give the table an appropriate name, and pick the views you want the new dimension to be available in.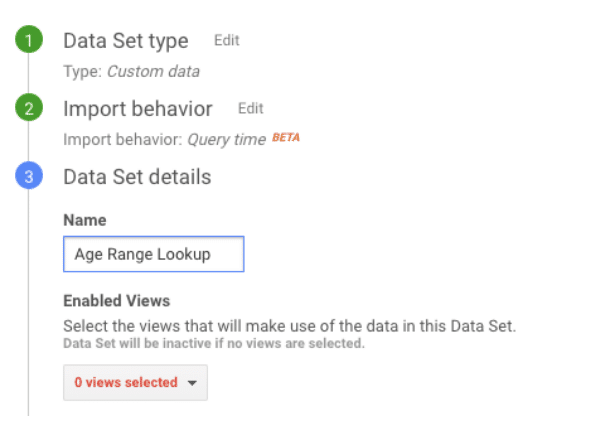
As you import the table, the Query Time process reads the first row of the CSV file and validates that the dimensions exist. When the process successfully uploads your file, you will see the timestamp, the name of the file you uploaded, and you now have the ability to download the file later, should you need to make revisions.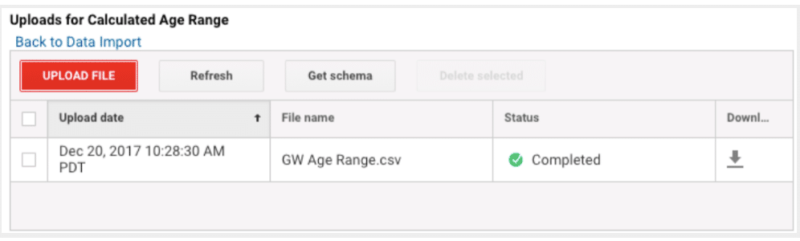
With the table in place, the beauty of the Query Time approach becomes clearer. We can run a custom report, or build a custom dashboard widget, that allows us to review the requested reports historically, and have the NEW Age Range data created based on the existing age dimension.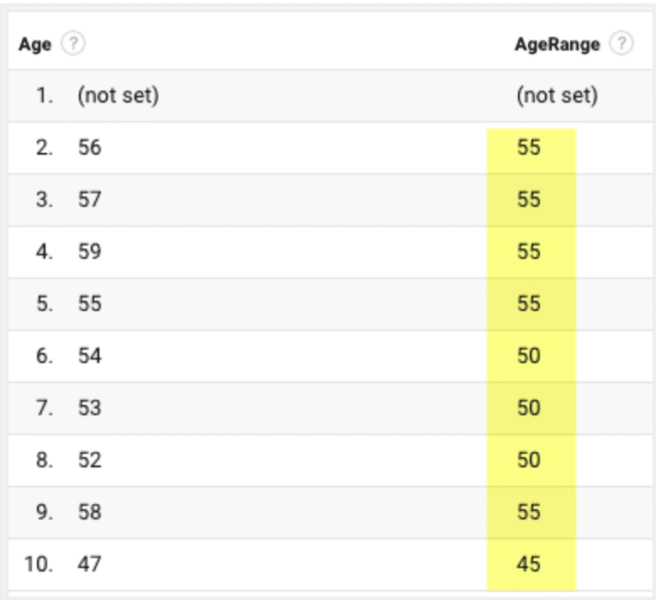
A Big Step Forward
With this new functionality Google Analytics 360 clients now have some tools to repair data.
In this example, we identified the issue as being the unexpected change in data sent to Google, we mapped out a solution to transform what we had into what we wanted, and we were able to produce the desired historic reports on the fly.
You may recall previous blog posts where we talked about Dimension Widening and how we can enrich data within Google Analytics. The key distinction between Dimension Widening and the new Query Time Data Import is WHEN data is enriched.
When we used dimension widening, data was added at processing time — meaning as each hit occur we were able to enhance it and create new dimensions.
When we use Query Time to create new data, we transform the data on the fly when we request a report that taps into historic data.
Thank you, @googleanalytics, for a groundbreaking change to the previously static nature of analytics data.
Thank you, Google, for a groundbreaking change to the previously static nature of analytics data. If your company has been on the fence about upgrading to 360, here’s one more check box in the plus column.
For further insights into ways to repair or enrich your data, please share your questions below by leaving a comment. We are happy to answer your questions and would love to have you share any thoughts you have on the Query Time Custom Data Import feature in Google Analytics 360.


If you have questions or you’re ready to discuss how Blast can help you EVOLVE your organization, talk to an Analytics Consultant today.
Call 1 (888) 252-7866 or contact us below.


