Analytics Blog

A/B Testing for the Greater Good of Your Business
Admit it. It’s happened to you. You toil away for hours to create the perfect A/B test recommendation and you’re sure you’ve got a winner. You anxiously watch the test results roll in, experiencing the rush when the variation is winning and the crash when it starts going downhill. When your test variation ultimately wins, you high-five your co-workers and act quickly to implement your recommendation.
But have you made the right business decision?
Check Your Emotions at the Door
 A/B testing, in many ways, is an emotional investment. It’s easy to get attached to your work product and it’s only natural to want to see it perform well. But sometimes it’s good practice to remind yourself why you’re doing it.
You’re not doing it for the win.
You’re doing it to gain insights about your business that will ultimately impact your bottom line.
One of the keys to successful testing is the ability to approach it without getting emotionally involved. When you take a step back, you don’t settle for overall results but are motivated to dig deeper. You become more interested in understanding why you’re seeing the test results you got rather than just claiming victory for a win.
Successful testing requires you to understand that testing doesn’t operate in a vacuum.
To properly assess whether your test win is a business win, you need to analyze your learnings in the context of the business. This includes knowing your customers and being aware of external factors that can impact the results.
The Blast team has the privilege of collaborating with Quicken to conduct A/B testing on their site. We recently concluded a test prior to the start of the busy holiday season, and the experience proved to be the perfect example of how to properly utilize testing to make an informed business decision.
Check out the full story below or download the Quicken A/B testing case study.
Start A/B Testing on the Right Foot: Initial Research & Protocol
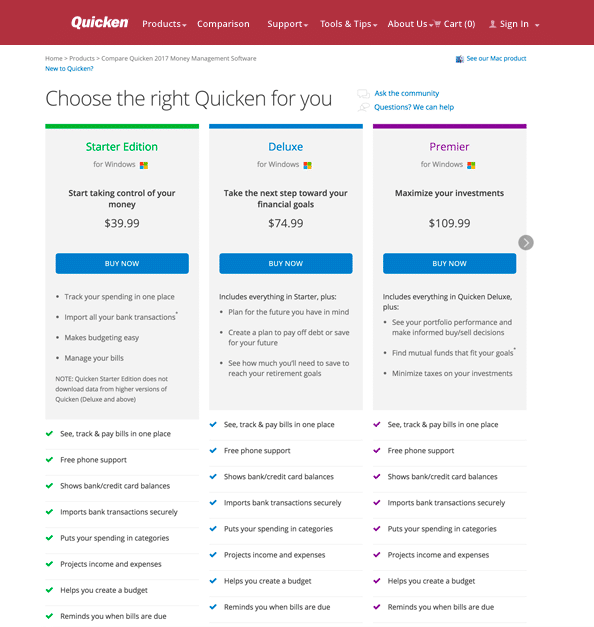
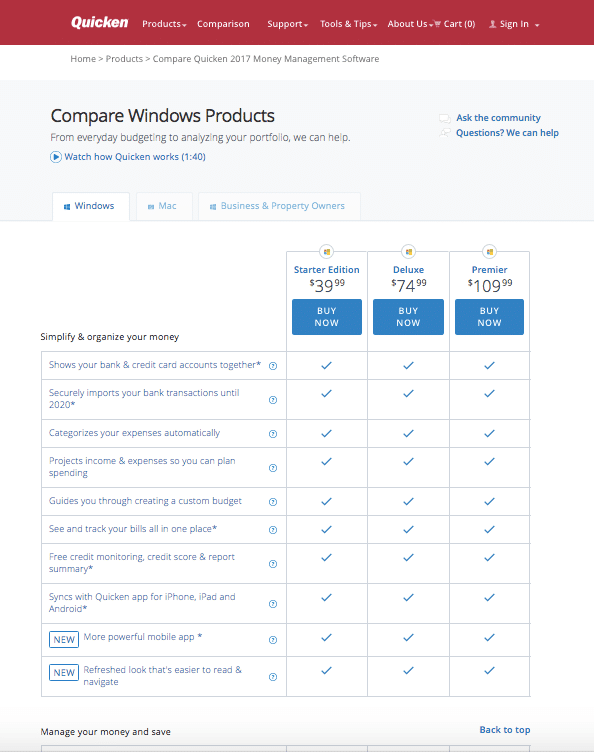
Conducting research and establishing a testing protocol laid the groundwork for successful A/B testing using Optimizely. For Quicken, creating a data-driven hypothesis involved performing extensive user research on their high traffic/high value product comparison page, www.quicken.com/compare.
The research revealed that the matrix on the page was integral to the decision-making process for both new and existing users.
A/B Test Control:

A test variation was created, which underwent additional rounds of qualitative studies to improve the design before conducting the quantitative test.
A/B Test Variation:

The next step involved having an agreed-upon A/B testing protocol before the test launched. Why, you ask? Well, have you ever wanted to stop a test because of the increase in performance you were seeing in the first few days?
If we hadn’t agreed to a specific duration beforehand, the test results would have stood a greater chance of being influenced by our emotions.
There was even greater pressure with this particular test, since the holiday season was coming quickly and Quicken had plans to send a product upgrade coupon that would bring users to the site in droves. They were hoping to launch, conclude, and implement the winning variation before Black Friday.
Even though there was a push to get results before the holidays, we agreed that the test needed to run for two weeks, the equivalent of two business cycles. This would allow each variation to gather enough conversion volume, and also allow us to account for varying visitor behavior for each day of the week.

The above graph highlights visitor behavior on the comparison chart page, based on day of the week. This shows that there is peak traffic on Mondays, while the latter part of the week has fewer visitors. If the test had run without completing full business cycles, the results could have been compromised because we wouldn’t be able to account for differences in behavior due to day of the week.
Surviving the First Week: Test Performance
Once it was established that test result updates would be provided at the end of each business cycle (rather than constantly peeking at updates), testing could begin.
The end of the first week displayed interesting results. The main key performance indicator (KPI) for this test was transaction rate (number of units sold/visitors to the landing page).
Other tracked metrics included add to cart rate (number of add-to-carts/visitors to the landing page) and cart-to-transaction rate (number of units sold/add-to-carts).
Transaction Rate

The primary KPI — which had well over a 1,000 conversions per variation and was nearing our required 95% statistical significance threshold — looked like it was underperforming. This was even more convincing after looking at the secondary metric:
Add to Cart Rate

This metric had over 1,000 conversions per variation and a statistically significant decrease in the number of visitors adding a product to their cart. The only positive metric was cart-to-transaction rate, which showed that even though there were fewer visitors adding to cart, the ones that did were more likely to convert.
Cart to Transaction Rate

Taking all of this data into account, Quicken very well could have decided to end this test. Luckily, they made the right call to take a step back, adhere to the testing protocol, and continue A/B testing for the second week. This decision proved to be vital.
Did That Just Happen? Test Performance Again
What a difference a week makes! Here’s what appeared at the end of the second business cycle:
Transaction Rate (2 Business Cycles)

There was a stunning reversal in transaction rate performance. With two weeks of data, the variation had a positive impact on transaction rate (+5.5%), which had ample conversion volume and also surpassed our 95% statistical significance threshold. The add-to-cart rate metric no longer had any impact.
Add to Cart Rate (2 Business Cycles)

The one metric that remained consistent was the cart-to-transaction rate, which again showed that the variation was better at converting visitors once they had added a product to their cart.
Cart to Transaction Rate (2 Business Cycles)

Take It to the Next Level: Test Results & Analysis
Based on this A/B testing data, we could have easily declared victory and implemented the variation. Instead, we questioned why we were seeing these results.
Looking at week-over-week data, we detected an unusual change in performance that went beyond the usual swing that can occur when conversion volume is low. We wanted to see what factors contributed to the control doing so well in the first week, and then the variation ultimately doing better after two weeks.
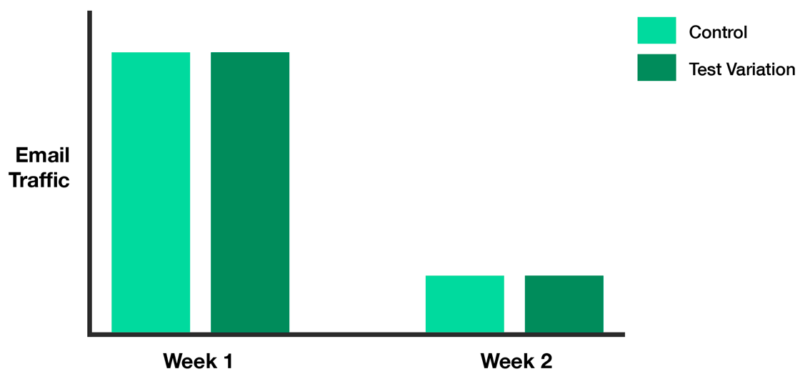
Quicken’s data was analyzed from multiple angles, uncovering a key insight when looking at the traffic by channel. What stood out was the amount of traffic coming from email during the first week vs. the second week:

For both the control and variation, email traffic made up a good percentage of total traffic in week 1, then sharply dropped in the second week. An email campaign that had launched during the first week targeting existing users was likely causing the poor performance of the variation during the first week of testing.
Due to the email campaign, the comparison chart page experienced an unusually high volume of existing users to the site in the first week.
Existing users were already familiar with the design of the original page and had an expectation of what it should look like when they clicked through.
Their expectations were not met when they landed on the variation page, and this type of change in the user experience (UX) is known to create friction.
The testing team knew from the qualitative research that the product matrix on this page — which was heavily redesigned for the test — played an important role in the decision-making process for visitors. Any friction with the product matrix’s UX could have a big impact on performance, which explained why we were seeing negative performance for the add-to-cart rate metric in the first week.
Add to Cart Rate (Week 1 Only)

During the second week, the portion of existing visitors coming from email decreased significantly, so performance from new visitors had more of an impact. In addition, running the test for a second week gave existing users time to become familiar with the new UX. This supports the positive change in performance for the variation (+12.27%) in getting visitors to add to cart in week 2 of testing.
Add to Cart Rate (Week 2 Only)

By taking the time to analyze data beyond overall results, we were able to come away with deeper insights beyond just learning that the variation won.
Which One Did Quicken Implement? Decision Time

Quicken asked the all-important question, “Does implementing the winning test variation make the most sense for the business?” To answer this question, other aspects of the business that may play a role in the effectiveness of the design had to be considered.
Keep in mind we were about a week away from one of their busiest days, and the whole purpose of running this test was to utilize the winning design for the holidays. Quicken understood their customer base and, considering past performance, pointed out that on Black Friday most visitors to the site are existing customers. In addition, most of them will have just received a coupon to upgrade their product.
It made sense to assume that there would be a greater proportion of existing users vs. new users visiting the comparison chart page, similar to what had happened during the first week of testing. Existing customers coming to the page with a coupon in hand would want an easy check-out experience.
Using our learnings from the first week of testing, we believed that implementing the “winning” design at this time could cause additional friction for existing users and negatively impact conversions.
In light of our findings, Blast recommended (and Quicken agreed) that although the test variation won, it would not be the best business decision to implement the variation for Black Friday. Instead, they decided to implement it at a later date, when existing users have more time to acclimate to the new design.
Patience is a Virtue
Deciding to go against the winning test variation wasn’t an easy choice for Quicken, especially considering the amount of effort that went into creating that test variation. However, it would have done a disservice to their business to implement the variation based solely on overall test results.
Understanding why we saw these results, and incorporating those key learnings with Quicken’s knowledge about its customer base, allowed the team to make an informed business decision.
Ultimately, that’s what successful testing is about – taking a step back and making a decision based on what is best for the business and not just claiming victory for the test win.


