Analytics Blog

4 KPIs that Can Make (or Break) Your SaaS Business
Subscription-based SaaS companies invest heavily in customer acquisition before they see a return on their investment. In some cases, this may take months, or even years before acquisition costs are recovered and profitability is achieved.
So how can you make sure that your SaaS business is on track to maximize business value?
You need these 4 Key Performance Indicators (KPIs) that are centered around acquisition, retention, and profitability:
- ASC (Active Subscriber Count)
- MRR (Monthly Recurring Revenue)
- CAC (Customer Acquisition Cost)
- CLV (Customer Lifetime Value)
Adopting these essential SaaS metrics to optimize your marketing strategy and support your decision-making will help you improve customer acquisition and retention efforts and sustainable profitability.
We’ll provide a detailed look at these KPIs that executive and marketing leadership must focus on to manage a successful SaaS business. Specifically, you’ll learn more about each of these SaaS metrics, why they matter, and how to calculate them.
Metric #1: Active Subscriber Count (ASC)
An active subscriber is a customer who is currently under contract to receive products and/or services from your business over a given period of time, typically a month or year. Since customers can sign up at will, and are free to cancel once their contract has expired, the active subscriber count is constantly fluctuating, depending on customer preference.
Why Does ASC Matter?
The success of a subscription business is based on its ability to acquire and retain active subscribers.
Subscription businesses that fail to focus on acquisition and retention will find that their customer base has abandoned ship and their costs are now dragging them down.
The initial goal is to grow active subscriber count, meaning that you have a net positive subscriber base week over week, month over month, and year over year. Since growth is generally a top priority for investors and executives, ASC is one of the top key performance indicators used in executive reports for measuring overall business growth and direction.
And while ASC is valuable on its own, the real value comes in understanding:
- which subscribers are most profitable,
- which are most engaging with the product,
- which are most likely to stick around, and
- which are most likely to churn.
Historic ASC is the foundation for predicting key metrics such as Monthly Recurring Revenue (MRR) Churn and Customer Lifetime Value (CLV).
How to Calculate ASC
The ASC metric is calculated as the running sum of Net Subscriber Count (NSC). NSC is determined by how many subscribers were acquired during a given period of time, minus how many subscribers churned or cancelled during that same period of time. The cumulative sum of Net Subscribers gives you ASC.
Let’s start with NSC, calculated from the following fields:
- Customer ID
- New customer sign ups (Acquisitions)
- Existing subscriber cancellations (Cancellations)
- Churned subscriber reactivations (Churns)
The next step is to count each unique action and aggregate them into a table. Here’s an example:
| Date | Acquisitions | Cancellations | Churns | NSC | ASC |
| 9/1/2016 | 22 | 2 | -7 | 17 | 17 |
| 9/2/2016 | 6 | 3 | -5 | 4 | 21 |
| 9/3/2016 | 10 | 0 | -4 | 6 | 27 |
| 9/4/2016 | 25 | 1 | -5 | 21 | 48 |
| 9/5/2016 | 23 | 2 | -8 | 7 | 65 |
| 9/6/2016 | 24 | 0 | -6 | 18 | 83 |
| 9/7/2016 | 13 | 0 | -2 | 11 | 94 |
Notice how ASC is a running sum of NSC as of the first date in the table. To calculate month-over-month ASC, select ASC as of 11:59pm on the last day of each month, and compare the current month to the previous month at the same time.
The calculation may look something like this:
ASC as of March 31st, 11:59pm = 950
ASC as of April 30th, 11:59pm = 1000
1,000 / 950 – 1 = 5.26% MoM growth
Since it’s a running sum you can see exactly how many active subscribers we have at any given point in time.
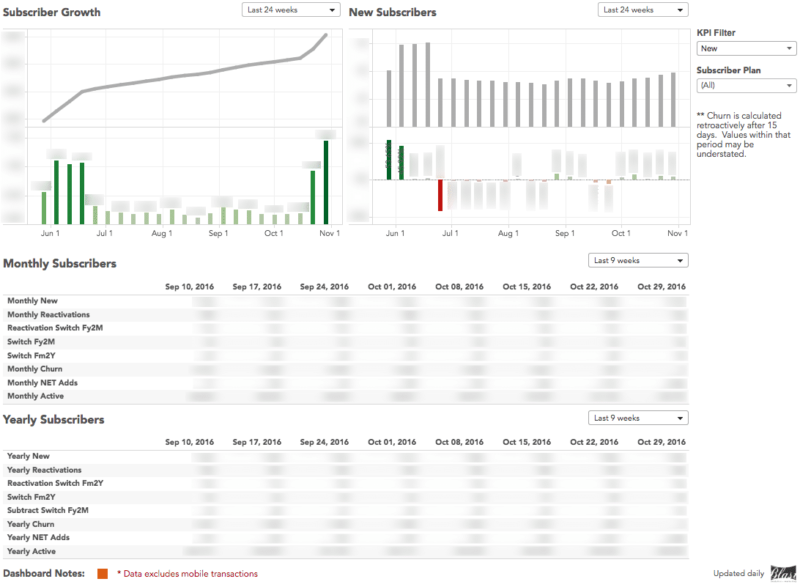
Here’s how this might look in an executive SaaS dashboard:
Metric #2: Monthly Recurring Revenue (MRR)
 The subscription-based SaaS business model is unique in that the value to the customer only materializes over an extended period of time, as does the revenue. Monthly Recurring Revenue (MRR), as its name denotes, is the sum of all revenues from recurring product plans, excluding all one-time, non-recurring payments such as setup costs and/or professional fees.
Why Does MRR Matter?
To say that MRR is an important SaaS metric would be somewhat of an understatement. Adding subscribers is important but don’t forget that the business will be short-lived without monetization. You can have millions of monthly subscribers but if you can’t convert them into paying customers you probably won’t be around for long.
MRR also supplies insight when analyzing changes such as plan upgrades, plan downgrades, pricing strategies, and discounts; or in putting together your financial budgeting and forecasting.
How to Calculate MRR
Calculating the MRR metric for a SaaS business that has only one plan is pretty straightforward. Multiply the monthly revenue by the number of active subscribers. A subscription business with a basic plan of $50 per month and 1,000 subscribers would be calculated as follows:
$50 (MRR) x 1,000 (subscribers) = $50,000 MRR
Most companies tend to have more complex pricing structures. Let’s imagine that your business has the same pricing structure as Zendesk:
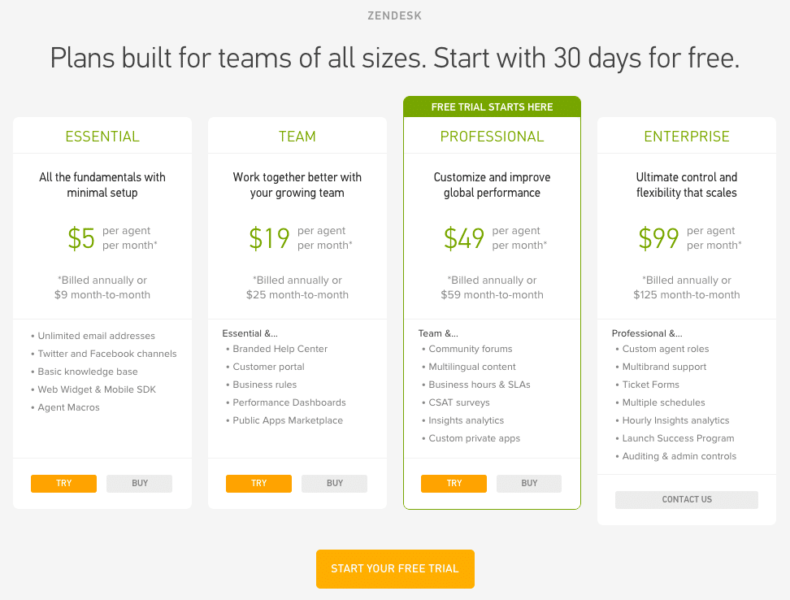
In addition to multiple plan tiers, this company also offers discount pricing for annual billing. Thankfully, they’ve done the work for us and specified how much the annual plan is on a monthly basis, which is simply the total price for the year divided by 12.
Ideally you will want to break out categories so that you can see exactly where your revenue is coming from. Calculations for this plan structure might look something like this:
| Essential | Team | Professional | Enterprise | Total Subscribers | |
| Monthly Subscribers | 1,000 | 1,000 | 1,000 | 1,000 | 4,000 |
| Annual Subscribers | 1,000 | 1,000 | 1,000 | 1,000 | 4,000 |
| 2,000 | 2,000 | 2,000 | 2,000 | 8,000 | |
| Monthly Plan Revenue | $9,000 | $25,000 | $59,000 | $125,000 | $218,000 |
| Annual Plan Revenue | $5,000 | $19,000 | $49,000 | $99,000 | $172,000 |
| $14,000 | $44,000 | $108,000 | $224,000 | $390,000 |
In this example, even though the company has initial commitments of $2,282,000 for the entire year ($172,000 x 12 + $218,000), the normalized total MRR is only $390,000.
Step it Up with CMRR
A more descriptive version of MRR (that is especially useful when booking long-term contracts that take time to implement) is Committed (or Contracted) Monthly Recurring Revenue (CMRR). The following variables may be included:
- New MRR – MRR associated with leads that convert to paid customers in a given time period.
- Expansion MRR – Any increases in MRR from existing customers in a given time period. These could be the result of customers adding additional subscriptions, upgrading, etc.
- Contraction MRR – Any decreases in MRR from existing customers in a given time period. These could be the result of downgrading to a lower plan, adding or increasing a discount, etc.
- Net New MRR – New MRR + Expansion MRR – Contraction MRR – Churned MRR
- MRR Churn – MRR from customers who cancel or fail to renew their subscription in a given period.
How to Calculate CMRR
To calculate the CMRR metric, start with MRR (New Business + Expansion – Contraction – Churn), then add in signed contracts going into production and subtract revenue that is likely to churn within that period.
Metric #3: Customer Acquisition Cost (CAC)
Customer Acquisition Cost (CAC) is the total cost of sales and marketing that was spent to acquire a single customer.
Why Does CAC Matter?
The primary goal in understanding the CAC metric for a SaaS business is profitability. Why would you spend hard earned dollars acquiring customers that are not profitable? In most cases, this would be counter productive (though exceptions exist for evangelists, media, and high-profile prospects).
CAC can help you understand the effectiveness of your sales and marketing program.
Are certain channels (e.g.S EO, PPC) becoming more or less expensive over time? Where are we reaping the greatest rewards? How much should we budget for each marketing channel?
Without Customer Lifetime Value (CLV), it’s almost impossible to determine which subscribers are actually profitable and which are not. As we’ll see in the next section, CAC in conjunction with CLV is a win/win!
CAC is also a useful SaaS metric for gauging the company’s ability to scale effectively, which is a main focus of investors and stakeholders. Remember, a subscription-based company must grow the subscriber base in order to counteract the effects of churn and acquisition costs. If that growth is not met by lower costs it may be difficult to absorb such effects.
How to Calculate CAC
The most basic formula for calculating the CAC metric can be determined by taking all sales and marketing costs and dividing by the total number of new customers that those sales and marketing dollars helped to acquire.
CAC = (Sales and Marketing Costs) / New Customers
Seems simple enough, right? And it is, for average CAC, which is what that calculation produces. But attributing costs at the individual level is considerably more difficult and can be much more complex.
Average CAC cannot answer the question, “How should we attribute costs based on the channel or campaign that acquired them?” For this reason many companies have looked to scoring models to help understand their channel attribution.
Scoring models can be based on a number of different factors.
Analytically mature companies are able to break down attribution by the level of user engagement with key marketing actions along the customer journey.
In most cases, however, companies will simply select a standard attribution method such as first interaction, last interaction, or other standardized methods.
The key to remember here is that there is no average customer. If you want average results then use averages, but if you want the best results, learn to segment your data to understand your true CAC.
Metric #4: Customer Lifetime Value (CLV)
Customer Lifetime Value (CLV) is a prediction of the value a business will receive from an on-going customer relationship over a defined period of time.
The goal of the CLV metric for SaaS companies is to determine which segments of customers are most valuable to the business based on the recency, frequency, and monetary value (RFM) of their purchases. For example, even though a customer may have purchased consistently in the past, if they have not purchased for some time they will likely have a much lower future CLV than customers with only a few recent transactions.
In most cases, recency trumps frequency.
Why Does CLV Matter?
CLV is the single most important metric for driving actionable change in your SaaS organization. In the world of SaaS marketing, CLV should be the focal point of your marketing strategy.
CLV can tell you which segment of customers you should be focusing your acquisition and retention efforts on and which ones you should not, and where to spend your hard-earned marketing dollars.
To illustrate, let’s say your company has acquired 1,000 customers over the past 5 years through the following marketing channels, and is developing a budget for this year to increase acquisition and retention.
| Channel | Spend | Customers | CAC |
| $6,000 | 600 | $15 | |
| YouTube | $6,000 | 300 | $20 |
| AdWords | $2,500 | 100 | $25 |
| $2,400 | 60 | $30 | |
| $1,000 | 40 | $50 |
Based on these figures you may be tempted to spend more money on Facebook Ads which shows the lowest CAC, right? Why spend $50 when I can spend $15 and get more customers?
But, what if customers from Facebook Ads were your worst customers? What if they only came for the promo, signed up for a month, churned, and went on to your nearest competitor for a new discount? You don’t want to put good money after bad. You also don’t want to spend even more trying to retain bad customers.
The following table shows a much more accurate picture:
| Channel | Spend | Customers | CAC | 24-Month CLV | Profit/Customer | Total Profit |
| $6,000 | 600 | $15 | $10 | -$5 | -$3,000 | |
| YouTube | $6,000 | 300 | $20 | $30 | $10 | $3,000 |
| AdWords | $2,500 | 100 | $25 | $50 | $25 | $2,500 |
| $2,400 | 60 | $30 | $200 | $170 | $10,200 | |
| $1,000 | 40 | $50 | $300 | $250 | $10,000 |
The goal is not to get every customer, rather the goal is to get the best customers. This is the value of CLV! Remember, CLV is forward-looking; ask, “What is a customer worth to me now and in the future?”
How to Calculate CLV
According to Peter Fader, one of the world’s leading experts on CLV, there is no “one formula” that can be used to compute lifetime value, as all businesses are unique. However, for a (continuous, contractual) subscription business, Fader suggests using a probability model called the shifted-beta-geometric (sBG) distribution model.
Due to the complexity of CLV, we’ll keep this fairly high-level. Here are the following steps to calculate CLV:
- Select a subset of your transactional data (say 4 out of 5 years of data)
- Perform a Recency, Frequency, Monetary value (RFM) analysis on the dataset
- Determine a forecast period
- Determine a discount rate
- Determine a margin of error
- Calculate the present value of all monetary values (using sBG model)
- Use the last year of the dataset to verify the model
- Now run the analysis on all 5 years of the data for accuracy
Since CLV is defined over a specified period of time, we typically would state “the customer’s 12- (or 24-, or 36-) month CLV is $xx.xx”, the period of time being how long we estimate the average customer relationship to be.
Seeing the Big Picture
The KPIs for a SaaS (subscription based) business should generally be centered around acquisition, retention, and profitability (which at times can take a back seat to growth). These 4 SaaS metrics will show you how you’re doing in each of those categories.
- Active Subscriber Count (ASC) – take a pulse on subscriber growth
- Monthly Recurring Revenue (MRR) – get direction around sustainability and competitive markets
- Customer Acquisition Cost (CAC) – understand how much you’re spending on each segment
- Customer Lifetime Value (CLV) – acquire and retain the best customers, stop over-investing in the rest
This final SaaS metrics dashboard example from Custora pulls it all together:

One final thought to leave you with; did you know that you can double your LTV by cutting your churn rate in half? Churn rate is another vital metric for a SaaS business that is related to retention. As churn is often associated with diminishing customer satisfaction. An effective way to analyze your churn rate is with cohort analysis. Before you go, take a quick look at our related case study on optimizing retention with cohort analysis.


If you have questions or you’re ready to discuss how Blast can help you EVOLVE your organization, talk to an Analytics Consultant today.
Call 1 (888) 252-7866 or contact us below.


