Analytics Blog

Don’t be Misled by Sessions in Google Analytics Custom Reports
As a reporting tool, Google Analytics does a great job in allowing you to manipulate data in whichever way you see fit to uncover insights and support critical business decisions. You want to see how many users from Micronesia used an iPad to view your latest blog post? Sure, no problem!
What if #GoogleAnalytics allowed you to customize a report so that you end up with deeply misleading data?
This flexibility is fantastic, but what if Google Analytics allowed you to customize a report in such a way that the you end up with deeply misleading data? Yes, this can happen and Google Analytics won’t warn you! Hey, you wanted the flexibility…
One of the most common instances of this occurs when people build custom reports using the “Sessions” metric.
Customizing Google Analytics Reports
Custom Reports and the Sessions Metric
Analyzing usage data at a session level can provide great insights into your website usage and user behavior. However, you can quickly get tangled up with questionable data when building custom reports using the Google Analytics Sessions metric.
You can get tangled in questionable data when building custom reports using the #GoogleAnalytics Sessions metric.
The following is an example using data from the Google Merchandising Store:
Suppose you’re interested in doing some page path analysis, particularly: “what pages were people on before reaching an apparel page?”
You build a custom report in Google Analytics that shows Previous Page Path for apparel pages, as well as the number of sessions that view each of these pages. With your report complete it’s Insights + Action time!
But wait a moment something doesn’t look right:
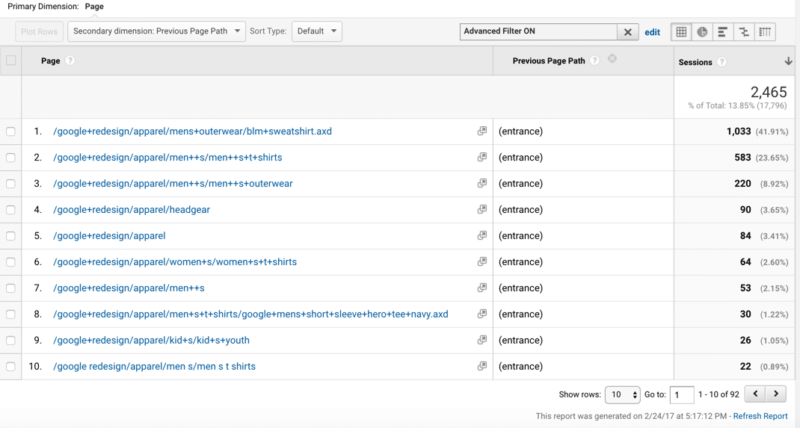
Why is every Previous Page Path showing as an (entrance)? There’s no way every single user who reaches an apparel page is entering the site on that page. You start to doubt the accuracy of your Google Analytics implementation.
Identifying the Problem
What Is Google Analytics Scope?
![]() First, let me assure you, the problem isn’t with your Google Analytics implementation (phew!). The problem is due to you having combined Sessions (a session level metric) with a selection of hit level dimensions.
First, let me assure you, the problem isn’t with your Google Analytics implementation (phew!). The problem is due to you having combined Sessions (a session level metric) with a selection of hit level dimensions.
Let’s dig a bit deeper into that. Every metric and dimension in Google Analytics is assigned a scope that defines at what level data is captured.
Scope can be one of 4 levels:
1. User-level
A metric/dimension that captures data about a user
| Dimensions | Metrics |
| Days Since Last Session | Users |
| Gender | |
| Age |
2. Session-level
A metric/dimension that captures data about a session
| Dimensions | Metrics |
| Organic Keyword | Sessions |
| Device Category | Bounces |
| Exit Page |
3. Hit-level
A metric/dimension that captures data about a hit (think of a hit as the most granular piece of data sent to Google Analytics)
| Dimensions | Metrics |
| Page | Pageview |
| Event Action | Total Events |
| Page Title |
4. Product-level
A metric/dimension that captures data about a product (only available if products are setup in Enhanced Ecommerce)
Google Analytics Scope and Data Collection
Page and Previous Page Path have hit level scope. This is because these dimensions get populated by multiple hits, multiple times during a session. That means that every time the user loads a new page, a hit gets sent to Google Analytics containing new data for each of these dimensions.
The metric Sessions has a session level scope. Metrics and dimensions with the session level scope get set once per session since they describe a unique piece of information about that specific session.
How Scope Impacts Data and Reporting
By combining Sessions with these hit level dimensions you’ve effectively made Sessions act as if it’s an Entrances metric. This is because you’ve unwittingly forced Page and Previous Page Path to show only their values from the very first page visited in each session.
By combining Sessions with hit level dimensions you’ve effectively made Sessions act as if it’s an Entrances metric.
Think this through — as hit level dimensions, Page and Previous Page Path get populated multiples times during a session. However, since you’ve combined them with the Sessions metric you’re forcing them to show data at the session level. Showing data at the session level means showing one piece of data about a session. Clearly this doesn’t really make sense for the dimensions we’ve used since they’ll have multiple values per session, unless the user bounced from your site. However, as they’re forced to show one piece of data about the session they’ll show only their first value of the session.
Therefore, Page will really only be showing Landing Page, meaning that the values showing under Sessions in your table are really showing Entrances.
This also explains the weird behavior of Previous Page Path. Previous Page Path is always (entrance) because Page is actually showing data for Landing Page. So, there is no Previous Page Path! Page is showing the first page of each session.
How to Fix the Problem
![]() To fix this Custom Report you’ll need to delete all of your Google tags, and then…just kidding! You’ll simply need to replace Sessions with a hit level metric such as Pageviews or Unique Pageviews. Then the hit level dimensions will play nicely with the hit level metric and produce real, actionable data.
To fix this Custom Report you’ll need to delete all of your Google tags, and then…just kidding! You’ll simply need to replace Sessions with a hit level metric such as Pageviews or Unique Pageviews. Then the hit level dimensions will play nicely with the hit level metric and produce real, actionable data.
In general, the rule you should remind yourself of when building custom reports is that your data is going to be most useful when you combine dimensions and metrics of the same scope. While there are exceptions, when you start to diverge from this you run the risk of generating faulty data, as we demonstrated in this example.
Your data is going to be most useful when you combine #GoogleAnalytics dimensions and metrics of the same scope.
Why Does Google Analytics Allow Me to Do this?!
For the most part, it doesn’t. If you’re using Google Analytics standard reports then you can’t add any metrics or dimensions to a report that would generate misleading data. It is only when you start building Custom Reports or using the Reporting API that you’re given the flexibility to make these mistakes.
Overall, I think the flexibility that working with Custom Reports and the Reporting API gives you far outweigh the risks that come with giving you the freedom to make mistakes. As long as you remember to create reports that use metrics and dimensions of the same scope then you won’t run into any problems.
The Bottom Line
Generally, you’ll likely be creating reports that use metrics and dimensions of the same scope without too much thought, since metrics and dimensions of the same scope seem to fit together like peanut butter and jelly. “Sessions” is the one metric we see most frequently used incorrectly with dimensions of hit level scope. It’s also the one that can cause the most problems with your data.
Keep an eye on how you’re using the Sessions metric in your Google Analytics Custom Reports!
For further help on the topic, Google provides a list of valid dimension-metric combinations.


If you have questions or you’re ready to discuss how Blast can help you EVOLVE your organization, talk to an Analytics Consultant today.
Call 1 (888) 252-7866 or contact us below.


