Analytics Blog
How to Use Google Analytics 4 to Track Your Buffy-Watching Habits
Google released out of beta recently Google Analytics 4 (GA4), a new, revamped way to measure sites that dramatically changes how we’ll capture site behavioral data moving forward. For those of us comfortable with Google’s Universal Analytics platform, which has been the standard-bearer since 2012, this will mean a total overhaul in all reporting, planning, and implementation.
In its announcement, Google promised a “new, more intelligent Google Analytics” that “has machine learning at its core to automatically surface helpful insights.” The new pattern will help unify measuring apps and websites, a common issue for site managers now.
![]() At its core, GA4 measures sites and apps in an events-driven model, where users and their specific actions make up primary reporting — rather than focusing mostly on sessions and pageviews.
At its core, GA4 measures sites and apps in an events-driven model, where users and their specific actions make up primary reporting — rather than focusing mostly on sessions and pageviews.
To really understand how to talk about the data and leverage it, I needed to map the events-driven pattern against something in my day-to-day.
The best analogy I’ve found: Watching old episodes of Buffy the Vampire Slayer on Netflix. Sure, you could sub in any other television shows, but why would you? And, yes, this is a bit of stretch and borderline silly, but, at least for me, silly is what helps me understand the topic better and have it stay top of mind. If you’re not a Buffy fan, the same ideas will carry over to your guilty pleasure show.
User Behavior Analysis: Once More With Feeling
Until this release, the main reporting methods in Google’s Universal Analytics really weren’t ever that much different than when the product first started in the days before mobile apps, massive cookie restrictions, or even phones that could reliably look at websites.
That makes sense why the patterns in the product would reflect the days before the Barack Obama presidency and Taylor Swift’s move from country to pop. GA4 will modernize the measurement to be more inline with a modern, cross-device world.
GA4 will modernize the measurement to be more inline with a modern, cross-device world.
Thinking how we’d understand users in this new events-driven world left me a little stumped at first. Sure, there have been a lot of products on the market such as Mixpanel, that had done this before and Firebase had been event-based since it was acquired by Google in 2014, but now we’re talking about the primary reporting in Google Analytics, which was also billed as the simplest of platforms to implement and simplest to pull data out of.
To really slay this new platform, I needed to map my understanding of Universal Analytics one-to-one with Google Analytics 4 and think through what types of questions I would ask of each system to better understand just how much of my life has been spent watching Sarah Michelle Geller and Charisma Carpenter take on a Hellmouth.
We’ll break down an events-driven driven model versus a pageview-driven model. It won’t be an epic apocalyptic battle of good and evil, but hopefully will be more entertaining.
What’s Different About Google Analytics 4?

Google’s Universal Analytics is based heavily on understanding sessions and the pageviews that happened during them. User counts can be found and evaluation can be done across sessions; but, at its core, the system is set up to understand sessions, pageviews in them, and then the events on the pageviews. In our data reviews, we focused on the unique pageviews (number of sessions that included a view) and unique events (the number of times an action with the same tagging was recorded in an event).
Google Analytics 4 removes the importance of the session and instead focuses on the user and the user’s events. The advantage will be more direct answers to questions that are commonly asked by user experience researchers and stakeholders. In Universal Analytics, we would answer “users have about two pageviews per session during the time period.” In GA4, we’ll answer “users have averaged about 4 pageviews each during the time period.”
Google Analytics 4 removes the importance of the session and instead focuses on the user and the user’s events. The advantage will be more direct answers to questions that are commonly asked by user experience researchers and stakeholders.
The shift to moving away from “per session” in the pattern is where things get different.
Additionally, Universal Analytics had a particular structure for how events should be handled leveraging three variables of Category, Action, and Label. Google Analytics 4 gives the option to define the structure for each event to provide the most context.
We’ll have the ability to combine our measurement between mobile apps and websites. In its early stages, Google Analytics 4 was called App + Web for this reason. We’ll still need a key of some kind to tie the same user across an app and a web visit, or rely on Google Signals to do that work for you
Let’s Bring Buffy Into This
To tie television watching to web analytics in a meaningful way, I needed to determine what I’m measuring and how those will map over. Sitting on my couch, I came up with the following comparisons:
- User: Me
- Session: Viewing sessions. I might have one on a weekend morning and then another in the evening. These can be spread differently by days. Each general viewing time would be my session or visit.
- Pageview: Watching a show. I’ll treat each show like a pageview. My reporting will need dimensions to understand which episode of Buffy for future reporting. For the purposes of my analogy, I’ll call this “Episode Watching.”
- Event: Aspects of the show (dialogue, fighting, singing). These will enrich my data about each session and pageview. If I were to do the same exercise for a network show or a Hulu show, I’d likely include an event for commercials.
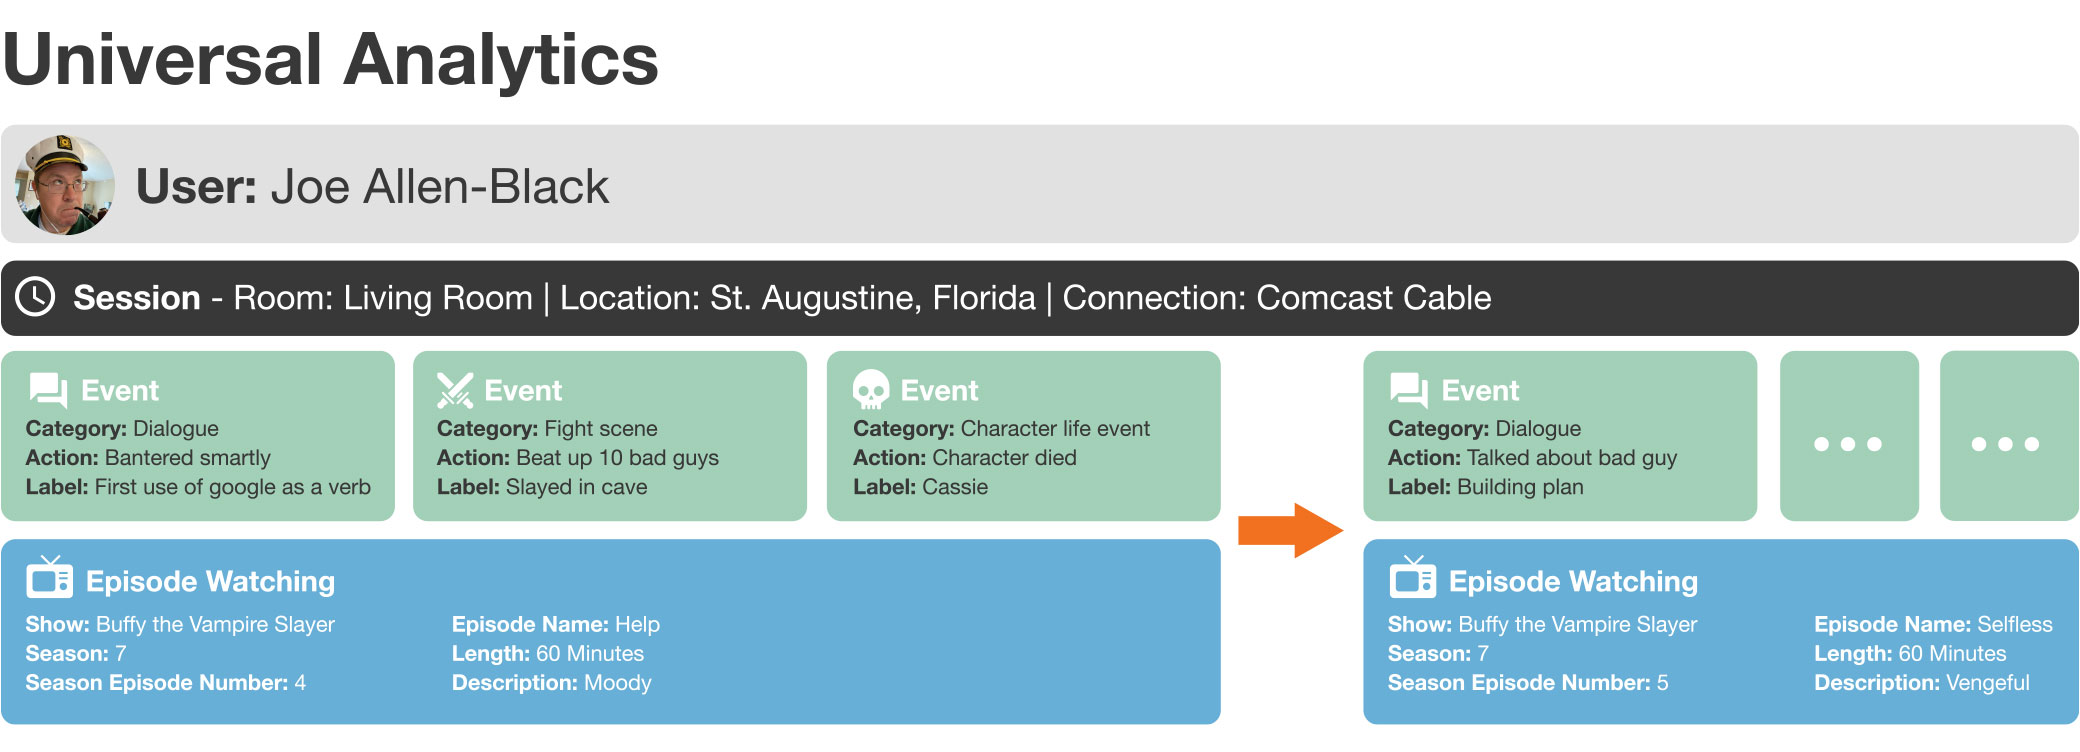
The key in all of this that the events are secondary to my pageviews and really play off the pageview. I could analyze the events on their own to see the number of fight scenes, for example. My expectation would be that the rich data on events would be shared with the page view.
In the example with my events, I’ll need to determine a way to fit the data into a category, action, and label pattern for my dimensions or leverage some custom dimension. Each event is expected to be largely analyzed in the same way tied to their session and pageview.
Translated to Google Analytics 4

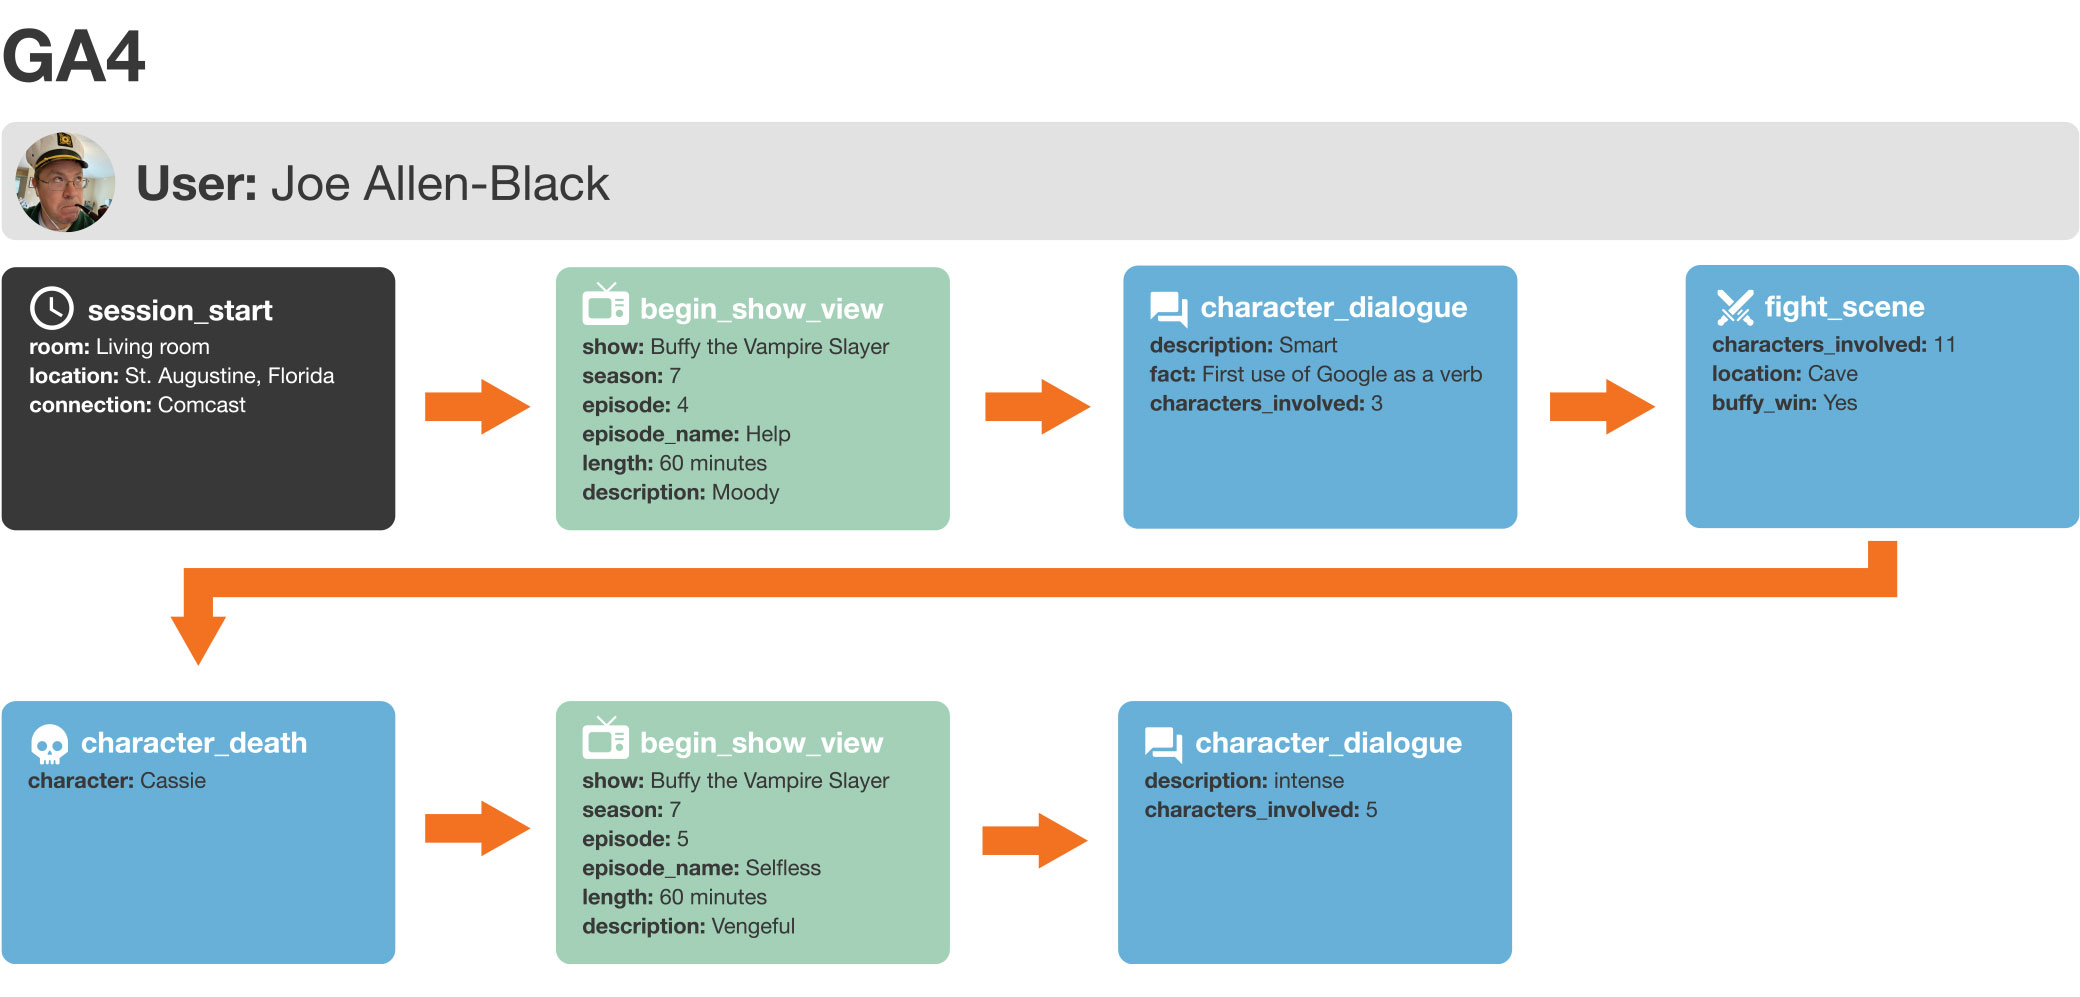
GA4 forces us to understand an event, then another event, followed by another event. Pageviews are on the same level as all other reporting. Previously, I thought about the show and then things happening during it.
Now, I’m going to focus on discrete actions happening in a sequence. My “pageview” will be the start of watching an episode. Continuing that, I’d want to have events to note key actions, such as “fight_scene.” I could go really granular with “song_began” and “song_ended” if we were looking at the Once More With Feeling in Season 6, the Buffy musical episode, but that might be a bit too much.
In contrast to our Universal Analytics plan, I’m now expected to define each action for tracking differently. Where I had to fit my events into category/action/label before, now I can define each separately. So, I can add more depth to data on fight_begins rather than being limited to a grouping of category, action, and label.
Each event can be tailored or stand alone — dialogue can be treated differently than fight_began. So, dialogue could get additional dimensions about the characters or type of emotion. fight_scene can focus more on weapons. Both can include location.
What Does This Mean?
We’re still going to be tracking largely the same events, but we can now:
- Ask questions that have the user, rather than the session, as the center of the response.
- Combine our mobile app analytics with web user data in a more direct fashion.
- Provide depth for events where needed.
The change will update how we set up tracking and report out all data to take advantage of the new system.
As the GA4 platform continues to mature, Blast is recommending implementing a dual tracking setup, where you can start bringing in data to GA4 and eventually have year-over-year data while maintaining your current tracking. This will allow an easier transition and experimentation with the new Google Analytics platform.
As you approach putting a stake in this new analytics pattern, please reach out to us if you need advice, have questions, or want our assistance.


If you have questions or you’re ready to discuss how Blast can help you EVOLVE your organization, talk to an Analytics Consultant today.
Call 1 (888) 252-7866 or contact us below.


