Analytics Blog

Improve Holiday Targets in Adobe Analysis Workspace
In the past, I’ve suggested different ways to insert target numbers into Analysis Workspace. Most of the time when I’ve suggested adding targets into your visualizations, it involves using data that already exists in Analysis Workspace. This usually comes in the form of year-over-year, month-over-month, or period over period numbers. From there, you can add different multipliers to increase or decrease your target (e.g., if you wanted to beat last year’s numbers by 5%, you can multiply those numbers by 1.05).
But what if your Adobe Analytics implementation is brand new and you haven’t experienced a holiday season yet? Or what if your target numbers are very specific and set by a whole team of people after careful research? What if you need these targets as granular as down to the hour? Is there still a way to add these types of targets into Analysis Workspace? Of course, the answer is yes. And of course, the answer is Calculated Metrics.
Getting the Data You Need
The trick we are going to use to get us there is to pick a date in the past that already has data in it, essentially hijack that data, and tell Adobe to give you a different number instead. I’ll show you what I mean with a very simple example below:

Simply put, what we’re telling Adobe is, if you’re looking at a trended view of visits by month, and the month you come to is October 2021, don’t give me the actual number of visits; instead, give me 8,000,000. Otherwise, give me the real visit numbers.
Here’s how that looks in a regular report:

As you can see, everywhere the “if” statement wasn’t satisfied, I just got my regular visits numbers. But when we reached October, I got 8,000,000 visits instead.
Implementing Across Your Targets
So how can we use this for our targets? Let’s use an example of Black Friday to put this into practice.
Let’s say our Black Friday order target numbers are as follows:

We’d input this data as follows:
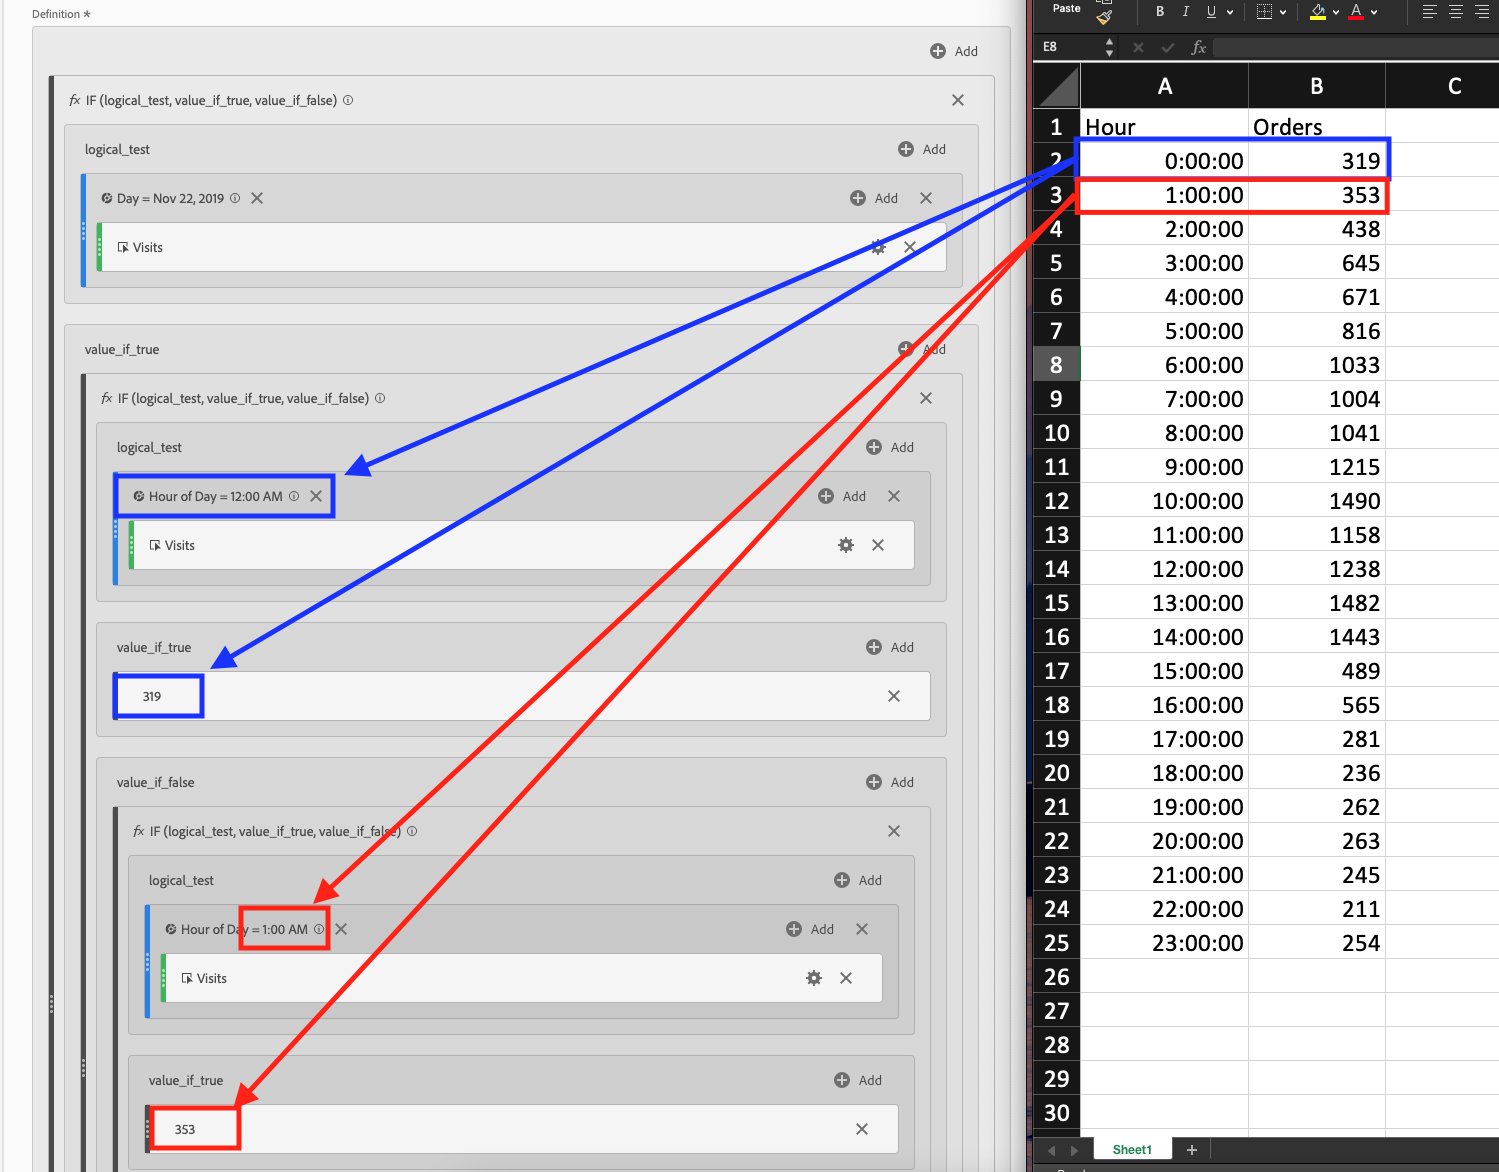
We’d sequentially add more “if” statements as we go for each hour of the day.
In the end, your metric will look like this (Click to enlarge):
[popup_anything id=”39393″]
So, after looking at this, I’m sure you have a few questions.
Q: Why am I using visits instead of orders in my “if” statements?
A: Remember, in order to have Adobe show us the number we care about, there first must be data for us to change. Using visits (the most universal metric) will give us the best chance of there being data in the early hours (2 a.m. – 4 a.m.).
Q: Why are you using the Friday before Black Friday instead of Black Friday (Ignore the fact that I’m using 2019; it just happens to have the best example data in this test dataset)?
A: I like to use a day in the past for two reasons: First, it allows me to test the metric out before the actual day gets here (remember, I can’t test this metric using days in the future because the data hasn’t been recorded yet). Second, I also like to be able to have my target fully trended out into the future so I can see my new data come in hour-by-hour and see how it stacks up:

Freestyle Your Data Reports
Once we’ve created this baseline metric, we can start to freestyle off it. For example, we can create a running sum view of this target to see your hourly progress toward your goal:

You can also quickly create scorecards to show how far above or below the target you are throughout the day.
This concept can be expanded beyond individual days as well. You can create daily or weekly targets for the whole holiday season, a quarter, or even an entire year.
Some ways I’ve used this tip for my clients include daily, weekly, and hourly targets for Visits, Orders, Revenue, Units, Average Order Value, and Conversion Rate.
Get creative and level up your Analysis Workspace dashboards this holiday season with targets for all of your key performance indicators (KPIs) this year:

To discuss further, or engage an Adobe Analytics consulting expert, contact us.


If you have questions or you’re ready to discuss how Blast can help you EVOLVE your organization, talk to an Analytics Consultant today.
Call 1 (888) 252-7866 or contact us below.


