Analytics Blog

Data Analysis: 8 Tips For Finding Signals Within The Noise
Your business is collecting more data on its customers and business operations than ever before. In fact, your company data is likely to double in size every four years based on current trends. In theory, this growing stockpile of data should equate to an increase in meaningful insights as well. However, in practice the inverse scenario often occurs as your organization finds itself increasingly “data rich” but “insight poor.” It’s estimated that only a small percentage of all data is actually being analyzed.
Amplifying Signals in Your Data

As companies seek to create a data-driven culture, too much of the focus is being spent on capturing data and not enough on uncovering insights. The brutal truth is that your data may hold a ton of potential value for your business, but it’s worthless if no one is able to extract useful, timely insights from it. If you’re struggling in this area like many other businesses, it’s just going to get harder as your data continues to get bigger over time. The noise will get louder and the signals will become fainter.
The brutal truth is your data may hold a ton of potential value for your business, but it’s worthless if no one is able to extract useful, timely insights from it.
To mitigate or overcome this challenge, there are a number of steps you can take to reduce the noise and amplify the signals in your data:
1. Start With Clear Business Objectives.
Well-defined business goals help you organize and prioritize what data matters to your business. When your business objectives are clearly articulated, it’s much easier to define what your key performance indicators (KPIs) and supporting metrics should be. Essentially, you create a hierarchy for your data that helps with separating the signals from the noise. Rather than getting lost in a churning ocean of data, you can focus on potential signals from a subset of key metrics that measure critical aspects of your business.
2. Evaluate the Data Quality.
It may be very hard to spot signals if they’re constantly obscured by noise from bad data. Anyone who has worked in analytics knows that no data is 100% perfect. Rather than distrusting all of your data and flying blind, it’s better to determine what data is still useful. It’s like looking in the fridge to see what ingredients aren’t spoiled, and then filtering your meal options accordingly. I’ve used this approach in consulting engagements, where I’ve noted what data appeared to be broken or missing, and then worked within the constraints of the data that was available. I won’t say it’s not frustrating to find contaminated or missing data, but it doesn’t need to block or end your quest for insights.
3. Answer Specific Business Questions.
Often having a focused purpose for your data analysis such as trying to answer a specific business question will be more productive than a general desire to discover something interesting in your data. For several years, I managed an analytics competition at Adobe in which students were able to analyze digital data for a real brand (Lenovo, Starwood Hotels, Backcountry, Comcast, and so on). For each competition, we asked the company to share a list of “burning questions” with the students, which we hoped would help the students to better frame their data analysis. By anchoring their analyses around specific business questions, we found the students were more effective in uncovering meaningful insights for the companies.
4. Be Objective as Possible.
We all carry certain biases with us. Being more open-minded and objective will enable you to discover more signals in your data. For entrepreneurs and business managers, personal successes and failures may influence how you view your data. You may “see what you want to see” and ignore signals because they conflict with your experience or intuition. For example, a fashion retailer had a number of collection pages that featured different sets of clothing items. When a consultant discovered they were performing poorly, he suggested further testing and analysis to improve them. However, he was quickly shot down with the statement, “Mr. (Family Business Owner) likes them that way, so we can’t change them.” While you may not be able to remove all your biases and assumptions, you should at least acknowledge what they are and watch for how they could affect your objectivity — causing you to miss a critical signal.
5. Add Ample Context.
When you’re analyzing data, the more context you have the better. If you’re fully equipped with information on your internal and external environments, you’re able to unlock signals that might not have been discernible from the noise. Simply knowing that a potentially influential event occurred (a new campaign or partnership, a process or policy change) adds valuable color when you’re analyzing your data. For example, a manufacturer was having quality issues on its production line, and it was able to isolate the problem to two of its factory machines. However, the data analysts couldn’t explain why these two particular machines were contributing to the quality issues as they appeared to be identical to other ones. By chance, when they walked the production floor, they discovered direct sunlight from a nearby window was causing those two machines to run hotter than other ones on the assembly line. Many helpful clues can live outside your data set, so you can’t afford to look at the numbers in a vacuum.
If you’re fully equipped with information on your internal and external environments, you’re able to unlock signals that might not have been discernible from the noise.
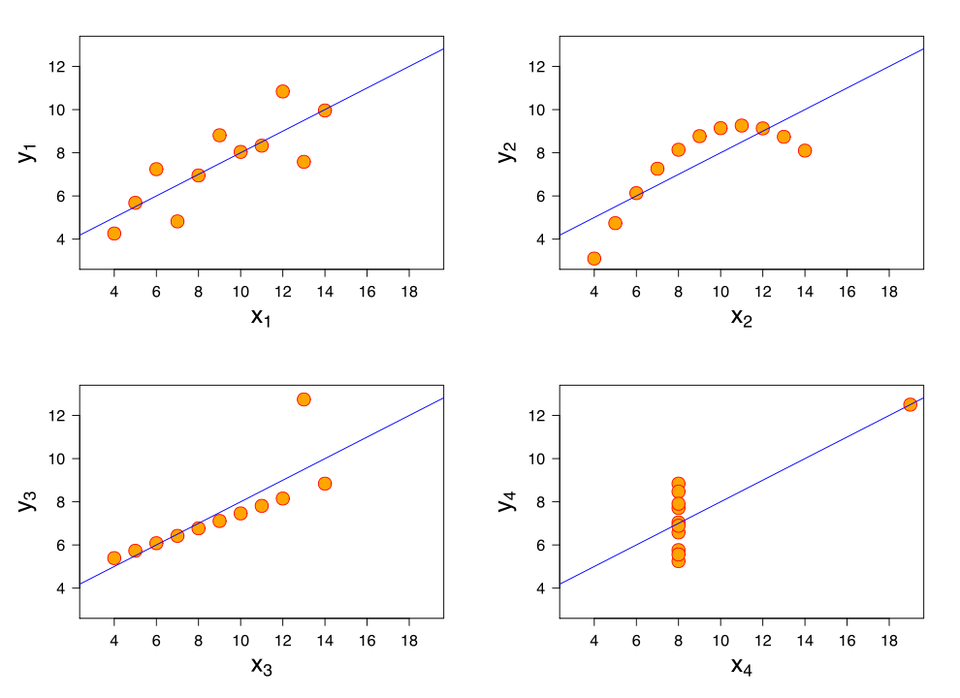
6. Visualize Your Data.
As datasets become increasingly complex with data, it’s harder to spot signals without the help of data visualizations. In 1973, statistician Francis Anscombe demonstrated the vital importance of visualizing data for analysis purposes. If one looked at a simple data table, no anomalies or patterns really jumped out numerically. However, when each data series was graphed, the visuals revealed how different the various data series were. In one example, a restaurant chain visualized its customer satisfaction data on a stylized, color-coded calendar. They were then able to pinpoint a particular shift (Wednesday afternoons) that underperformed all others. While they could have discovered this anomaly using number crunching, it would’ve taken far more effort to identify.
7. Use Technology to Sift and Organize Data.
As the volume and complexity of your data increases, it becomes harder for human beings to comb through it manually for insights. When the steps in the data analysis process are laborious and repetitive, you need to let machines do the heavy-lifting instead. A few years ago, a colleague and friend of mine discovered an insight that translated into several million dollars for a major e-commerce site. It took him six weeks of performing data analysis to pinpoint the signal. Today, what took him weeks now only takes minutes using advanced analytics technology. The right tools can significantly augment your analytical skills and save you time.
8. Hire and Develop Sharp Analytical Minds.
You need to have as many eyes looking for signals as possible. Too often, small businesses and even large ones invest in the technology but fail to invest in the people behind the tools. You don’t necessarily need to hire a data scientist (they’re expensive and hard to find), but you should consider having a dedicated data analyst of some kind — even if you just start with a smart college intern or an external consultant. Furthermore, you need more of your team exploring the data on a daily or weekly basis, which will require an investment in training. Self-service analytics tools are making the data more accessible to non-technical business users, but training is essential to seize the full potential of these tools. Finally, as you build out your data analysis team, look for individuals who are comfortable with using data. Data analysis is no longer someone else’s job — it’s now a shared responsibility of everyone.
Unveil Insights in Your Data
Professor Patrick Wolfe, Executive Director of the University College of London’s Big Data Institute, said, “The rate at which we’re generating data is rapidly outpacing our ability to analyze it.” When data is pervasive and insights are elusive, focus is essential. You can narrow your search for signals by focusing on what data is important to your business and what data is usable. If you stay open-minded and tap into as much tribal knowledge as possible, more of the noise will dissipate to reveal signals. Data visualization and analytics tools can also augment your ability to spot these signals, and having more eyes on the data will only increase the flow of insights into your business.
The next challenge will be what you’re going to do with the influx of new insights, and that will be a good problem to have.
This article was originally published on Forbes.com.


If you have questions or you’re ready to discuss how Blast can help you EVOLVE your organization, talk to an Analytics Consultant today.
Call 1 (888) 252-7866 or contact us below.


