Analytics Blog

Defining ETL Process Steps (to import Google Analytics into Data Warehouse)
![]() This is the first part of a two part series covering ETL process steps using Google Analytics as the data source. In this post I’ll be reviewing basics like why data warehouses exist, what kind of infrastructure is needed for ETL, and how to determine your ETL data requirements. Come back next week for part two where I’ll provide you with some of the nitty gritty implementation aspects via a real world Google Analytics ETL example.
This is the first part of a two part series covering ETL process steps using Google Analytics as the data source. In this post I’ll be reviewing basics like why data warehouses exist, what kind of infrastructure is needed for ETL, and how to determine your ETL data requirements. Come back next week for part two where I’ll provide you with some of the nitty gritty implementation aspects via a real world Google Analytics ETL example.
ETL Deserves a KISS (or at Least Some Love)
When I was in 6th grade, I became a huge fan of KISS. I can still remember the first KISS album I bought, KISS Alive II, the announcer yelling “You Wanted the Best, You Got the Best, the Hottest Band in the World….KISS!” But there was a problem, KISS didn’t receive much airplay on the radio. In a week, I’d have to sit through countless Rod Stewart and Rolling Stones songs before I might hear one KISS song, and it was always Beth or Rock and Roll all Night. It just wasn’t right.
You have a need for specific data, but the system it’s on won’t let you access it in the way you need. This is why data warehouses are created. Click & Tweet!
What, you ask, does this have to do with ETL (Extract Transform Load)? Everything!
My solution for not being able to hear more of KISS? Over time I just bought all the KISS albums. Then I “extracted” them from vinyl, “transformed” my favorite songs into the order I wanted, excluded others I didn’t want (the Unmasked album…what were they thinking?!?), added songs from other sources and “loaded” them onto tape. Now I could listen to my favorites whenever I wanted, no putting up with Rod Stewart or The Rolling Stones!

Why Data Warehouses Exist
You have the same problem I had with KISS, only it’s with your data. You have a need for specific data, but the system it’s on won’t let you access it in the way you need. It might have restrictions on what is available, how much you can analyze at one time, an inability to enhance it with additional data, or is limited by the reporting tools which can access the data.
That is why data warehouses are created, they give you the ability to:
- Own your data
- Customize your data
- Enhance your data
- Retain historical data as long as you need
- Use any tool you desire to access, analyze, and report on your data
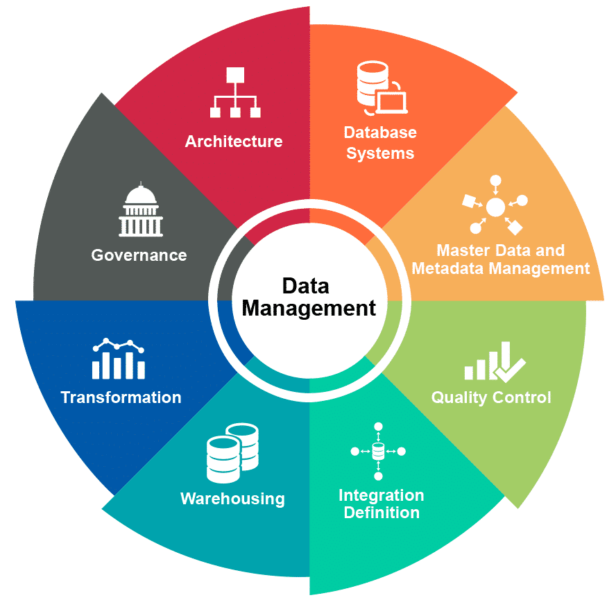
ETL is a key component in data management. Being able to create a data warehouse allows you to shape the data to meet your needs, and most importantly, use that data to provide Insights + Action.
Being able to create a data warehouse allows you to shape the data to meet your needs, and most importantly, use that data to provide Insights and Action. Click & Tweet!
Consider Google Analytics, which limits your reporting capabilities in several ways:
- Depending on the amount of data you are querying against, you might start getting sampled data. Sampling is Google’s solution to reducing the amount of data that users query, which the more data you request to report against, the more impact there is to the system. So if you query against data for a full year, depending on the amount of traffic on your website, you will most likely get sampled data. This means that Google will look at the time frame you requested, randomly sample that data, and extrapolate it to give you the results. The results can be reasonable…or not. When you are making critical business decisions, you don’t want to rely on an algorithm which estimates your actual data, you want to use the real, complete data.
- Google limits the number of dimensions and facts you can query. Custom Reporting allows you to query 5 dimensions and 10 metrics. Google’s API allows you to query 7 dimensions and 10 metrics (25 in the flat table mode). If you want more than this, you need to upgrade to Google Analytics 360 and have your data exported to Google Big Query, where you will have click level data and can query your data using SQL or Big Query’s Query language. More likely, you would extract the data to excel to do your reporting, or extract it and move it to your data warehouse where you can customize it to meet your needs.
For those who don’t want to take the plunge and become a Google 360 client, ETL (Extract, Transform, and Load) programming provides an alternative to meet your reporting needs. Although the ETL setup/process example that I will discuss is related to Google Analytics as a data source, the concepts apply to any data source.
Creating an ETL program to extract and load Google Analytics data to your own data warehouse (or database), will allow you to bypass Google Analytic’s sampling issues as well as the 10 metric constraint. You will still be limited to 7 dimensions, but there are some ways of squeezing in some additional dimensions.
Creating an ETL program to extract and load Google Analytics data to your own data warehouse (or database), will allow you to bypass Google Analytic’s sampling issues as well as the 10 metric constraint.
The steps to create your ETL process and data warehouse are as follows:
- Create the infrastructure to support the ETL programs and the data warehouse
- Determine and document your data needs
- Create the database model for your data
- Create the database, schemas, tables, and constraints
- Create the ETL
- Test
- Implement
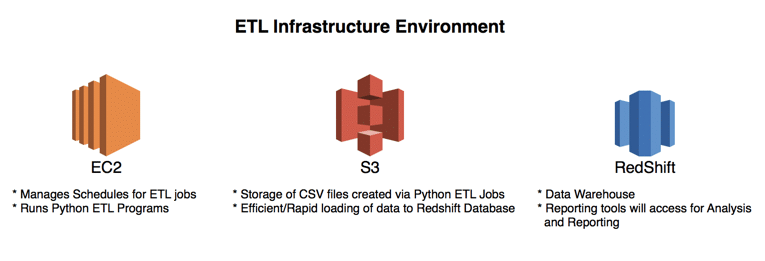
Creating an ETL Infrastructure
To get started you’ll need to establish the infrastructure for your ETL process and data warehouse. To keep costs low, reduce resources required to administrate and maintain, and allow rapid implementation with tremendous flexibility, I recommend the following:
Programming Language

You can use a common programming language, such as Python, to create your ETL program. Python, being an open source language, offers the following advantages:
- Reduced cost: No upfront cost for licensing, annual maintenance, or upgrades
- Ease of support: Python is a common language known by many developers, so it isn’t difficult to find resources to support and meet your programming needs
ETL Database
![]()
For a data warehouse I recommend AWS Redshift (although any one of the AWS database solutions is possible).
Using AWS cloud solutions you don’t need to invest in the hardware, IT resources and IT infrastructure to manage your data warehouse, as AWS will do all of it for you at a very low price. AWS offers fully managed database solutions which includes:
- Fully Hosted: AWS is responsible for hardware, Operating System, and Database software (upgrades and patches). You don’t need to hire DBA, IT resources, or buy and manage hardware, AWS does it for you.
- Security and Compliance:
- Network isolation
- Database instance IP firewall protection
- AWS IAM based resource-level permission controls
- Encryption at rest
- High Availability
- Scale up or down as needed (cost will adjust accordingly, you aren’t restricted by hardware you purchased, you can easily adjust!)
- Backups and Snapshots
- Multi Zone: Hardware problems will result in failover to another region/zone (you define which one)
Servers to Run Your ETL
AWS offers servers, or elastic computing (EC2). What does this mean?
- Computing is on demand: pay by the hour, no long term commitments
- Resizable: increase/decrease performance/memory as needed, almost seamlessly
- Flexibility: low cost options for development and test
- No up front investment: if you do this on your own, you are committed to what you purchased
- Fully managed: hardware issues are managed as part of the service, most times you won’t even notice a disk failed or memory had to be replaced, etc.
- Fully dedicated: you are not sharing with others
Running your own servers requires full-time staff, a dedicated facility with proper cooling, power management, and other needs. And planning is complex, you can easily over or undersize your computing needs. But AWS takes care of all the above, allowing you the flexibility to resize your computing needs all with a click of a mouse.
Storage For Resulting Data Files
AWS offers flexible storage solutions (S3):
- Simplicity: Web-based management console, mobile app, and full REST APIs and SDKs for easy integration with third party technologies.
- Durability: Available in regions around the world, and includes geographic redundancy within each region as well as the option to replicate across regions.
- Scalability: Costs grow and shrink on demand, and global deployments can be done in minutes.
- Security: Supports data transfer over SSL and automatic encryption of your data once it is uploaded. You can also configure bucket policies to manage object permissions and control access to your data using AWS Identity and Access Management (IAM).
- Broad integration with other AWS services such as databases (Redshift), designed to integrate directly with Amazon S3.
Defining ETL Data Requirements
Next, you need to determine your reporting needs. What are your goals and objectives that you are trying to measure? What business question are you trying to answer?
Once identified, you should be able to determine the fields you need from data sources, transformations that will be required (such as calculated fields), and additional data that will need to be added. Some common process steps in transformation that you will want to consider:
- Modify Data:
- Rename fields – provide common field names and naming conventions across data sources
- Clean and Modify values in fields – ensure consistent and accurate values
- Split fields – fields that contain multiple values can be split into individual fields
- Aggregate data – aggregate by specific dimensions/attributes or by date (e.g. monthly, annually, etc.)
- Filter out data (test data, known bad data, specific customers, date ranges, etc.)
- Enhance Data:
- Add Calculated fields – ensure complex or common calculations are already provided so users don’t have to create calculations on their own
- Join additional data from other data sources – provide user friendly names for codes, etc.
- Union additional data from other data source
In our example, our reporting requires the ability to analyze the following dimensions and metrics from Google Analytics:
| Dimensions | Metrics |
| Campaign | Bounces |
| Channel Grouping | Clicks |
| Date | Goal 1 Completions |
| Event Action | Goal 2 Completions |
| Event Category | Goal 3 Completions |
| Event Label | Goal 4 Completions |
| Medium | Goal 5 Completions |
| Source | Goal 6 Completions |
| Goal 7 Completions | |
| Goal 8 Completions | |
| Goal 9 Completions | |
| Goal 10 Completions | |
| Goal 11 Completions | |
| Goal 12 Completions | |
| Goal 13 Completions | |
| Goal 14 Completions | |
| Goal 15 Completions | |
| Goal 16 Completions | |
| Goal 17 Completions | |
| Goal 18 Completions | |
| Goal 19 Completions | |
| Goal 20 Completions | |
| New Users | |
| Page Views | |
| Session Duration | |
| Sessions | |
| Total Events | |
| Transactions | |
| Users |
In addition, to help with our reporting, we need the following:
- We have more than one view (or client) from Google Analytics that we need data from, so we need to be able to provide a user friendly name for each view or client, called Account
- User friendly names associated with the various goals
- Although we are pulling Google Analytics channel grouping, we need to define our own Channel based on the values found in Source and Medium
- Create an Event Name based on the values found in Event Action, Event Category, Event Label
Lastly, we need to pull the data daily. Google Analytics can take up to 4 days before the data is finalized (if you aren’t a 360 customer). As such we have two choices:
- Have the ETL program pull data from Google Analytics for a particular date four days later. For example, data for June 2nd would be pulled on June 6th to ensure you have the “finalized” data.
- Have the ETL program pull data from Google Analytics for the past 4 days, and the data pulled will replace the dates already in the data warehouse. For example, on June 6th, you will be pulling data for June 2nd, June 3rd, June 4th, and June 5th. The data for June 2nd through June 4th will already exist in your data warehouse, but the new data just pulled may have revisions, so you will need to delete those three days of data from the data warehouse and replace them with the new data pulled.
- Some data warehouse architects will argue that you should never delete or update data. However, the end goal is to have data for analysis as soon as possible, and the ability to have it modified if the data changes. Sometimes business needs and goals have to take precedence above technology needs and ideals. Technology should enable and meet business needs and requirements, not the other way around. (Hmmmm, will I get comments on this?)
- Your database administrator may have concerns that deleting data will result in poor query performance, as some databases don’t reclaim or re-organize tables when data is deleted. However, in databases like Redshift, there is a VACUUM option, which will re-allocate disk space, re-sort the data, and you can then ANALYZE the table to refresh statistics, so this problem is eliminated.
ETL Process Strategy Phase Is Complete!

That’s a wrap for part one of these two part ETL series. If you have any questions, comments, or tips of your own regarding the ETL process steps in the setup phase, please share them in the comments. Look out for next week’s post where I’ll be diving deeper into a Google Analytics specific ETL implementation and providing details on how to accomplish the following:
- Creating the data model
- Creating the database, schemas, tables, and constraints
- Developing the ETL
- Testing and implementation
Related Insights

Digital Analytics


If you have questions or you’re ready to discuss how Blast can help you EVOLVE your organization, talk to an Analytics Consultant today.
Call 1 (888) 252-7866 or contact us below.


